731
Internet Map
Taken from here
Hello everyone!
I want to introduce you a map of the Internet or the result of clustering more than 350 thousand sites in accordance with the user navigates between them. The size of the circle is determined by site traffic, color - nationality and location on the map - it links to other sites. If two sites have a steady stream of users between them, then they will "try" to stay close to each other. Upon completion of the algorithm, the map can be seen clusters of sites (clusters) are united by common users.
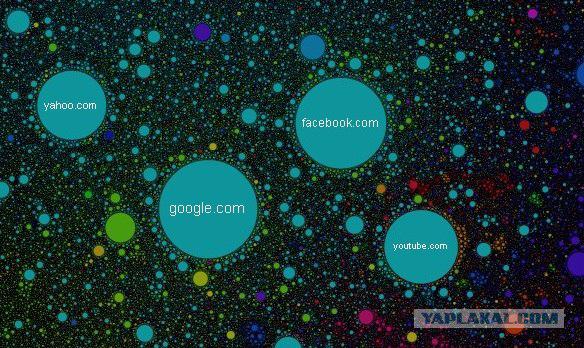
For example, if you type in the search habrahabr.ru, we can see that dirty.ru and leprosorium.ru in the same "constellation" and yet away livejournal.ru. This suggests that those who are reading this text, and with a high probability of visiting these sites (relative to the average Russian Internet user of course).
An even more interesting example of clustering can be seen at the bottom of the map, between Japan and purple yellowish Brazil: there is a whole pornostrana size comparable with all Euronet. Interestingly, being competent enough in the matter, within a large pornoklastera can distinguish themed subclusters smaller.
For those interested in a brief technical description - welcome under the cut
Engineering part
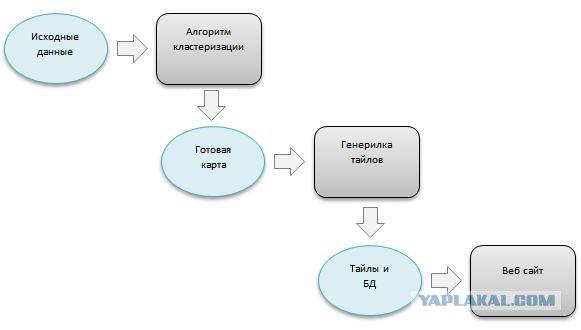
The entire project is written in C #, and consists of three parts: a program of clustering, the program generating tiles and website. Each part deserves special consideration and, if there is interest, I could then tell us more about them.
Baseline data were collected from Alexa, they represent a record of attendance, upstream and downstream users transitions (upstream - where they came from, downstream - where did). After normalization, we obtain a weighted undirected graph with vertices and 350 thousand more than 2 million. Ribs.
Counting this graph - a complex computational problem, so it was written by a special module for the GPU, but fortunately he did not need. After a tricky optimizations shortchanging all took a few weeks of continuous work of a powerful, but still a household iron.
Speaking simply, the algorithm was incremental sites on a map in accordance with the forces acting on them. Many transitions users - a powerful force trying to bring together the sites; If the sites are too close, it starts the repulsive force, etc. More details can be found in this work reports-archive.adm.cs.cmu.edu/anon/1998/CMU-CS-98-189.pdf
The main problem was the enormous computational complexity of this algorithm. After solving the problem "head" at each step must be calculated superposition of forces for each site, ie, calculate the power for each pair of sites, and such pairs around 122 billion. (good for one step, right?). It was therefore held tough and full optimization algorithm parallelization. Fortunately .net platform was surprisingly good for such amusements.
The second step is the generation of tiles. Tile - a small picture 256x256 pixels that make up the image of a map on google maps, yandex and other services. In general, nothing complicated - Generate big picture, cut it into squares of desired size, the business somehow. But these images was almost 30 million. Even just to copy or delete a directory with tiles in windows it takes two days. And pour them into hosting a separate issue.
The third phase - the engine tie google maps, put the pieces together, and get it to display a map. Here, in general, there is nothing difficult, although there were some difficulties with the projections and the positioning of the card.
The last stage - the choice of hosting and release. Here, too, it was not without adventure. Now it turns into a cloud of Amazon and it was much easier and cheaper than I had imagined.
In general, I have accumulated some experience, and I'll be glad to share it with a respected community. Of course, in general, nothing special, Habré are really interesting projects and trivial solutions, but still, I think, to many it can be fun.
I also look forward to any ideas, reviews, criticism - any feedbacks!
Source:
Hello everyone!
I want to introduce you a map of the Internet or the result of clustering more than 350 thousand sites in accordance with the user navigates between them. The size of the circle is determined by site traffic, color - nationality and location on the map - it links to other sites. If two sites have a steady stream of users between them, then they will "try" to stay close to each other. Upon completion of the algorithm, the map can be seen clusters of sites (clusters) are united by common users.

For example, if you type in the search habrahabr.ru, we can see that dirty.ru and leprosorium.ru in the same "constellation" and yet away livejournal.ru. This suggests that those who are reading this text, and with a high probability of visiting these sites (relative to the average Russian Internet user of course).
An even more interesting example of clustering can be seen at the bottom of the map, between Japan and purple yellowish Brazil: there is a whole pornostrana size comparable with all Euronet. Interestingly, being competent enough in the matter, within a large pornoklastera can distinguish themed subclusters smaller.
For those interested in a brief technical description - welcome under the cut
Engineering part
The entire project is written in C #, and consists of three parts: a program of clustering, the program generating tiles and website. Each part deserves special consideration and, if there is interest, I could then tell us more about them.

Baseline data were collected from Alexa, they represent a record of attendance, upstream and downstream users transitions (upstream - where they came from, downstream - where did). After normalization, we obtain a weighted undirected graph with vertices and 350 thousand more than 2 million. Ribs.
Counting this graph - a complex computational problem, so it was written by a special module for the GPU, but fortunately he did not need. After a tricky optimizations shortchanging all took a few weeks of continuous work of a powerful, but still a household iron.
Speaking simply, the algorithm was incremental sites on a map in accordance with the forces acting on them. Many transitions users - a powerful force trying to bring together the sites; If the sites are too close, it starts the repulsive force, etc. More details can be found in this work reports-archive.adm.cs.cmu.edu/anon/1998/CMU-CS-98-189.pdf
The main problem was the enormous computational complexity of this algorithm. After solving the problem "head" at each step must be calculated superposition of forces for each site, ie, calculate the power for each pair of sites, and such pairs around 122 billion. (good for one step, right?). It was therefore held tough and full optimization algorithm parallelization. Fortunately .net platform was surprisingly good for such amusements.
The second step is the generation of tiles. Tile - a small picture 256x256 pixels that make up the image of a map on google maps, yandex and other services. In general, nothing complicated - Generate big picture, cut it into squares of desired size, the business somehow. But these images was almost 30 million. Even just to copy or delete a directory with tiles in windows it takes two days. And pour them into hosting a separate issue.
The third phase - the engine tie google maps, put the pieces together, and get it to display a map. Here, in general, there is nothing difficult, although there were some difficulties with the projections and the positioning of the card.
The last stage - the choice of hosting and release. Here, too, it was not without adventure. Now it turns into a cloud of Amazon and it was much easier and cheaper than I had imagined.
In general, I have accumulated some experience, and I'll be glad to share it with a respected community. Of course, in general, nothing special, Habré are really interesting projects and trivial solutions, but still, I think, to many it can be fun.
I also look forward to any ideas, reviews, criticism - any feedbacks!
Source:
