1708
"E-waste" per capita - interactive map shows the real situation in each country
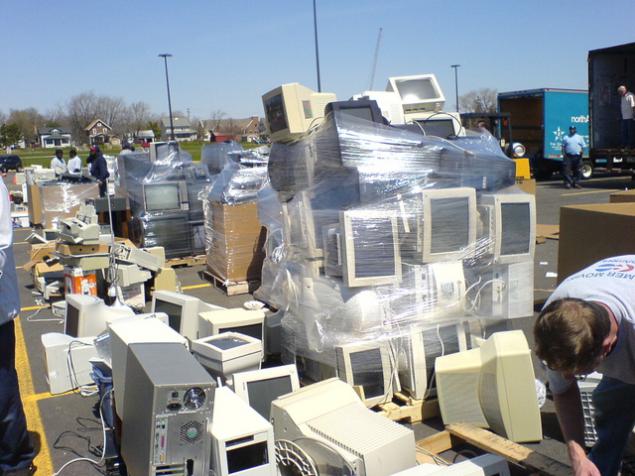
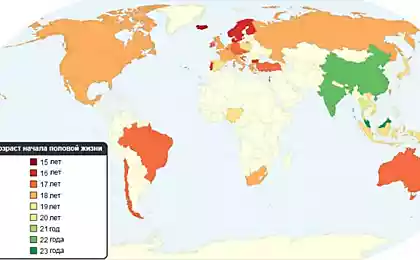
Since the production of computers, mobile devices and other electronics is increasing, respectively, and gradually increasing the number of "e-waste" - because it is necessary to do something with obsolete and damaged equipment. Here it also discarded, and in spite of all attempts to establish recycling of this type of waste, the majority still goes to the scrap without any processing. A few days ago the organization StEP Initiative introduced interactive map , where you can see how many "e-waste" falls on per capita, since such waste is recycled, and how much to buy new equipment population.
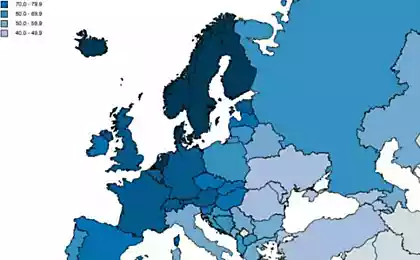
In addition, the map shows which standards and regulations relating to the disposal of electronic waste, act in a certain region. The map is really very informative, so many representatives habrasoobschestva this data will be of interest, and can - be useful for.
Organization submitting the card, also published and sufficiently representative data regarding high-tech waste. So, the year 2017 is expected to increase this type of "garbage" on the third, up to 65, 4 million tons per year. This includes PCs, and TVs, and smart phones, and electronic toys, and, for some reason, refrigerators.
On the map you can see information on the number of e-waste on every continent and country. As mentioned above, you can view the current rules and regulatory policy regarding waste in a particular region. It is worth noting that it is not necessarily in the so-called "developed" countries deal with the disposal of electronics things well. Quite the contrary.
With regard to individual countries, at the head of the list of the main "producers" of e-waste worth US 9, 4 million tons of this type of waste per year, and China, with 7, 3 million tons.
Via theverge
Source: habrahabr.ru/post/206236/