1829
Putting an elliptical trainer and pygame
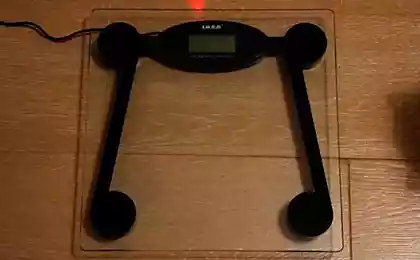
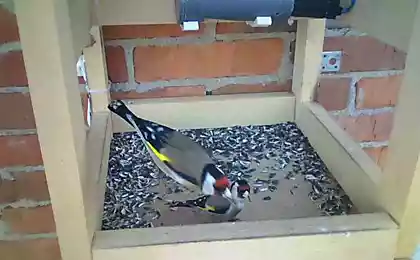
Hello, friends! It happened so that recovery from injury, I bought myself such a device.
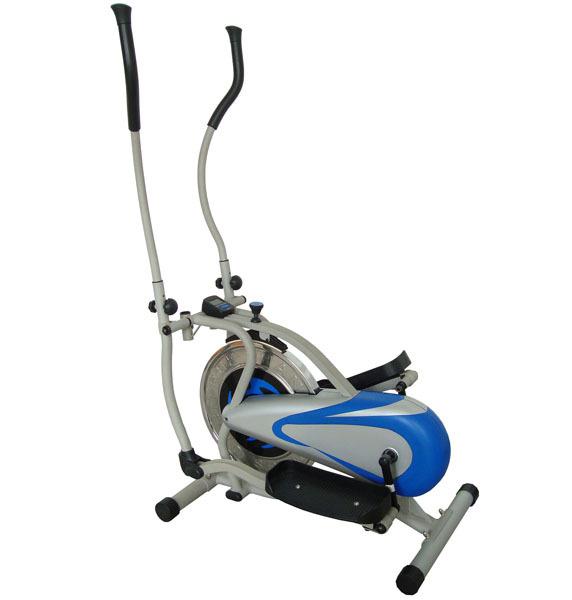
With their duties, he coped quite well, but there was a "but", and it consisted in the fact that the speedometer was confused in the testimony, and therefore show different results on the distance traveled. If you go slowly enough, the speedometer at all silent. And it was decided to make the speedometer with ... well, you understand.
How to connect a computer simulator and h4>
Game h4>
Idea h5>
Calculations h5>
Passion h5>
Technical Details h4>
Database h5>
Graphics h5>
Forms h5>
Charts h5>
Reading data from arduino h5>
Video demonstration of poor quality h4>

With their duties, he coped quite well, but there was a "but", and it consisted in the fact that the speedometer was confused in the testimony, and therefore show different results on the distance traveled. If you go slowly enough, the speedometer at all silent. And it was decided to make the speedometer with ... well, you understand.
How to connect a computer simulator and h4>
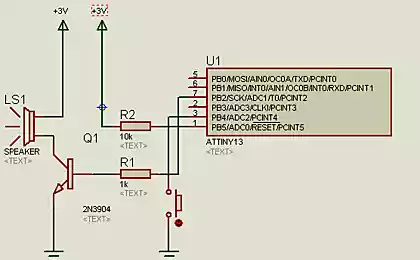
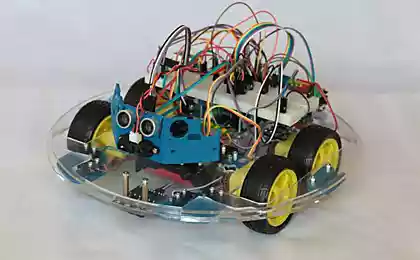
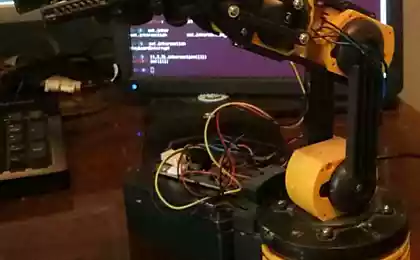
First, where it was decided to begin - to find a way to get the data on the computer. Intermediary, it was decided to use the card Arduino
Why Arduino ? Because it is not at hand or anything else suitable.
On examination it was found that from the simulator to the sensor are two wires.
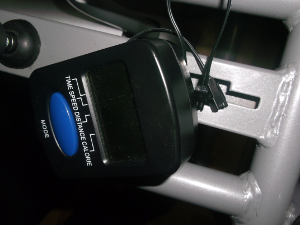
What would be enough to connect it to the pins Arduino
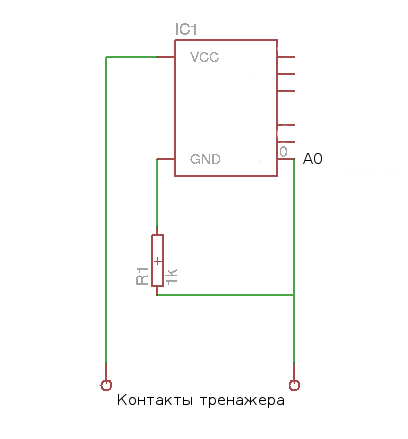
On contact A0 , depending on the position of the pedals, the signal will be supplied of different sizes.
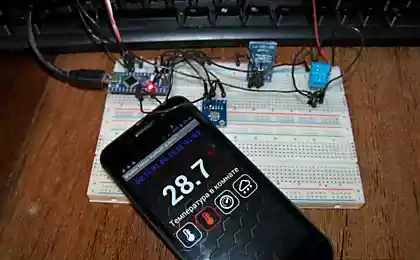
During the experiments were tried many options the alarm from the microcontroller to the computer, and eventually settled on this version:
on the computer in continuous cast of characters «0» , then, when a step in the simulator, served «1» «0» and so the circle.
Here is sketch


& lt; code class = & quot; cpp & quot; & gt; int pin = A0; int ledPin = 13; int minSignal = 600; bool stateUp = false; bool lastState = false; bool oneStep = false; void setup () {pinMode (pin, INPUT); pinMode (ledPin, OUTPUT); Serial.begin (9600); } Void loop () {int signal = analogRead (pin); if (signal & gt; minSignal) {stateUp = true; } Else {stateUp = false; } If (lastState! = StateUp & amp; & amp; lastState == false) {oneStep = not oneStep; } Else {} lastState = stateUp; Serial.println (oneStep); digitalWrite (ledPin, oneStep); // Indicator} & lt; / code & gt; pre>
Game h4>
What else to write on pygame if you do not play? I>
Idea h5>
The elliptical trainer is a simulation skiing, so it will be a race skiers. Every step taken in the simulator makes the character in the game. First wanted to make smooth movements \ acceleration character, but eventually decided to give preference to accuracy.
Calculations h5>
Empirically, it was found that the "optimal" circumstances one full turn equals 4th meters. This is probably not what man is, and how many scrolls central disk. Just accept this value as an axiom.
On the virtual track 1 meter equals 1 pixel. Ie each step move persnazha 4 pixels forward.
The rate will be calculated each step.
v = s / t
s = 4 m.
t - the time one step.
* one step - full turn the pedals. I>
Passion h5>
Yes, there are graphics and speedometer with a timer, but I want the spirit of competition.
But what if you will not compete with someone and with yourself, yesterday ? Said - done.
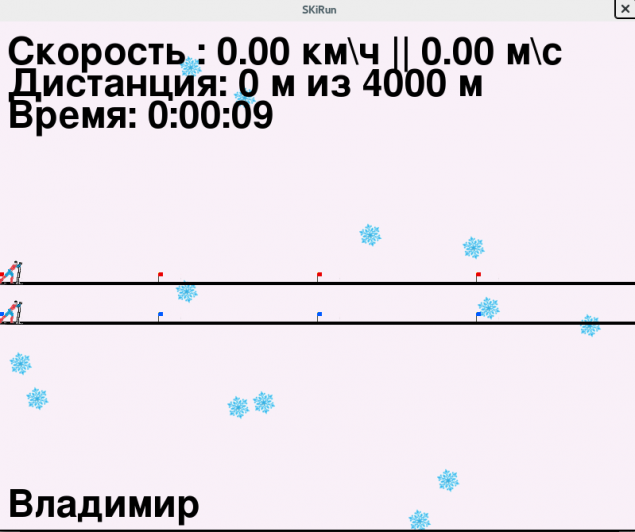
On top of the character today, below - yesterday. To be more precise - the character of the last race but agree that the first option sounds cooler.

Technical Details h4>
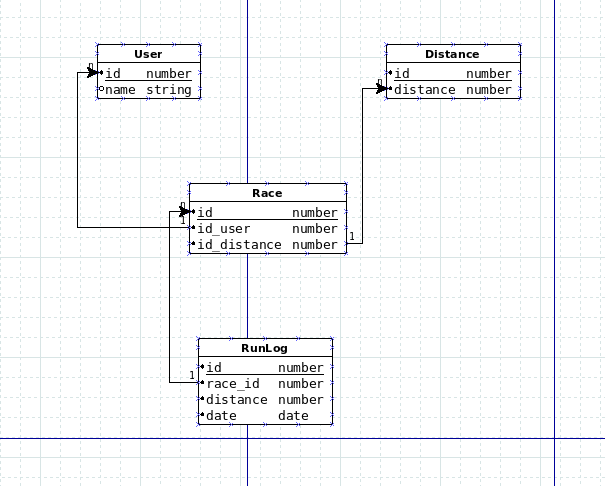
Database h5>
Naturally, just need to save information about the races, we need a database. I decided to use mysql python using a library MySQLdb DataManger
The scheme is applied.
Sample Code

& lt; code class = & quot; python & quot; & gt; slass DataManager: def __init __ (self): self.time = time self.currentTimeForLastRace = datetime.now () self.currentTime = self.time.time () self.speed = 0 self.db = MySQLdb.connect (host = & quot; localhost & quot ;, user = & quot; root & quot ;, passwd = & quot; root & quot ;, db = & quot; skirunner & quot ;, charset = 'utf8') self.cursor = self.db.cursor () self.isGetLastRaceSpeeds = False self.dataLastRace = [] self.lastRaceMinDate = datetime.now () self.value = 0 self.lastValue = 0 self.impulse = 0 self.isRaceStart = False self.currentRaceId = -1 self.currentDistanceId = -1 self.currentProfileId = -1 def getImpulse (self, value): self.impulse = 0 if self.time.time () - self.currentTime & gt; RESET_SPEED_TIME: self.speed = 0 self.value = value if self.value! = Self.lastValue: time = self.time.time () - self.currentTime self.impulse = POWER_IMPULSE self.isRaceStart = True self.speed = STEP / time # meters per second self.currentTime = self.time.time () self.lastValue = self.value return self.impulse def getLastRaceDistanceAtCurrentTime (self, raceId, currentTime): lastRaceDistance = 0 dateFormat = & quot;% Y-% m -% d% H:% M:% S.% f & quot; if not self.isGetLastRaceSpeeds: sql = & quot; & quot; & quot; SELECT min (date) FROM runLog WHERE race_id =% s & quot; & quot; & quot; % RaceId self.cursor.execute (sql) data = self.cursor.fetchall () for rec in data: self.lastRaceMinDate = datetime.strptime (rec [0], dateFormat) sql = & quot; & quot; & quot; SELECT distance, date FROM runLog WHERE race_id =% s ORDER BY date DESC & quot; & quot; & quot; % RaceId self.cursor.execute (sql) self.dataLastRace = self.cursor.fetchall () self.isGetLastRaceSpeeds = True if self.isRaceStart: time = datetime.now () - datetime.fromtimestamp (currentTime) for rec in self. dataLastRace: distance, date = rec if time & lt; = (datetime.strptime (date, dateFormat) - self.lastRaceMinDate): lastRaceDistance = distance return lastRaceDistance & lt; / code & gt; pre>
Graphics h5>
As you can see from the screenshot above, the graphics primitive, but it is not the main thing here nyashnost. To implement it, the library was used pygame wrote.
Forms h5>
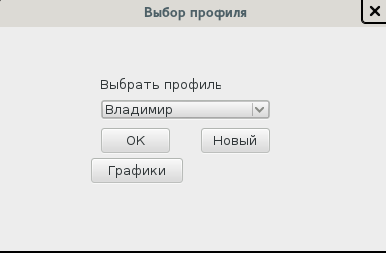
To use forms library PyQt
Sample Code

 & lt; code class = & quot; python & quot; & gt; class FormProfile (QMainWindow): def __init __ (self): super (QMainWindow, self) .__ init __ () uic.loadUi (' % s / ui / frm_profile.ui '% DIR, self) self.cb_profile_load () self.te_newProfile.hide () self.bt_addProfile.hide () self.bt_cancel.hide () self.lb_add.hide () self.move (QDesktopWidget (). availableGeometry (). center () - self.frameGeometry (). center ()) self.connect (self.bt_ok, SIGNAL (& quot; clicked () & quot;), self.bt_ok_clicked) self.connect ( self.bt_new, SIGNAL (& quot; clicked () & quot;), self.bt_new_clicked) self.connect (self.bt_addProfile, SIGNAL (& quot; clicked () & quot;), self.bt_addProfile_clicked) self.connect (self.bt_cancel, SIGNAL (& quot; clicked () & quot;), self.bt_cancel_clicked) self.connect (self.bt_graph, SIGNAL (& quot; clicked () & quot;), self.bt_graph_clicked) def bt_ok_clicked (self): self.profileId = self. cb_profile.itemData (self.cb_profile.currentIndex ()). toString () self.formDistance = FormDistance (self.profileId) self.formDistance.show () self.hide () & lt; / code & gt;  pre>


I loved the development process windows. No more difficult than in the  MS studio
Forms created in the  Qt 4 Creator
Import it into the code
& lt; code class = & quot; python & quot; & gt; uic.loadUi ('% s / ui / frm_profile.ui'% DIR, self) & lt; / code & gt; pre>
Related events, and methods of & lt; code class = & quot; python & quot; & gt; self.connect (self.bt_ok, SIGNAL (& quot; clicked () & quot;), self.bt_ok_clicked) self.connect (self.bt_new, SIGNAL (& quot; clicked () & quot;), self.bt_new_clicked) self.connect ( self.bt_addProfile, SIGNAL (& quot; clicked () & quot;), self.bt_addProfile_clicked) self.connect (self.bt_cancel, SIGNAL (& quot; clicked () & quot;), self.bt_cancel_clicked) self.connect (self.bt_graph, SIGNAL (& quot; clicked () & quot;), self.bt_graph_clicked) & lt; / code & gt; pre>
And display
& lt; code class = & quot; python & quot; & gt; self.formProfile = FormProfile () self.formProfile.show () & lt; / code & gt; pre>
Charts h5>
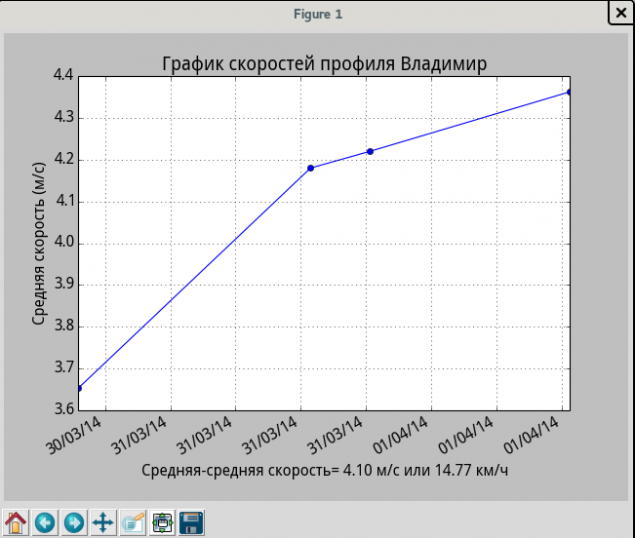
Charting library is used matplotlib.
There is also the example code

& lt; code class = & quot; python & quot; & gt; import matplotlib.pyplot as plt def bt_averageSpeed_clicked (self): ... plt.plot_date (dates, values, 'b ') plt.plot_date (dates, values,' bo ') averageSpeed = len (values) & gt; 0 and (lambda: sum (values) / len (values)) or (lambda: 0) plt.xlabel (u & quot; High-average speed =% .2f m / s or% .2f km / h & quot;% (float ( averageSpeed ()), float (averageSpeed ()) / 1000 * 3600)) plt.ylabel (u & quot; average speed (m / s) & quot;) plt.title (u & quot; The velocity profile% s & quot;% dm.getProfileNameById ( self.profileId)) plt.gca (). xaxis.set_major_formatter (mdates.DateFormatter ('% d /% m /% y')) plt.gcf (). autofmt_xdate () plt.grid (True) plt.show ( ) & lt; / code & gt; pre>
I would like to note that to display Cyrillic fonts supporting the need to connect.
& lt; code class = & quot; python & quot; & gt; from matplotlib import rc font = {'family': 'Droid Sans', 'weight': 'normal', 'size': 14} rc ('font', ** font) & lt; / code & gt; pre>
Reading data from arduino h5>
For this purpose, use a library serial
The following code runs in a separate thread.
 & lt; code class = & quot; python & quot; & gt; def getDataFromSimulator (): global valueFromSimulator, isRunnig ser = serial.Serial ('/ dev / ttyACM0', 9600) while isRunnig: value = ser.readline () try: valueFromSimulator = int (value) except: pass & lt; / code & gt;  pre>

The variable  valueFromSimulator  in the other thread is used only for reading.

Running two streams.
& lt; code class = & quot; python & quot; & gt; t1 = threading.Thread (target = main, args = (self.profileId, self.distanceId)) t2 = threading.Thread (target = getDataFromSimulator) t2.start ( ) t1.start () & lt; / code & gt; pre>
Video demonstration of poor quality h4>
As ordered.
I will be glad comments, criticisms and suggestions. I>
All source code here
Source: habrahabr.ru/post/217891/


The incredible strength of will and love for life!
Funny comics, black humor and funny caricatures of the day