453
As the browser will draw ...
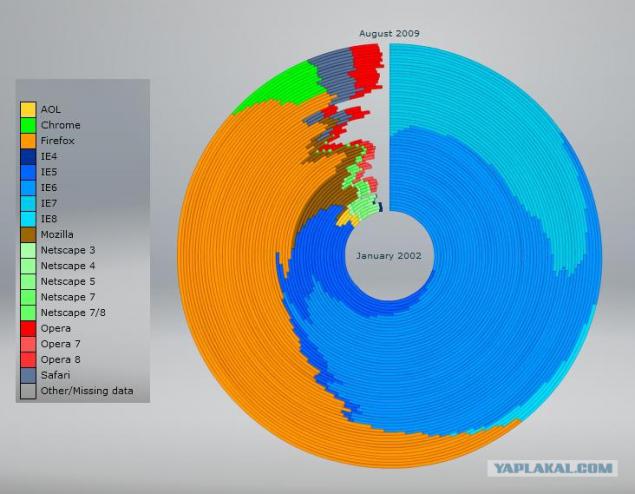
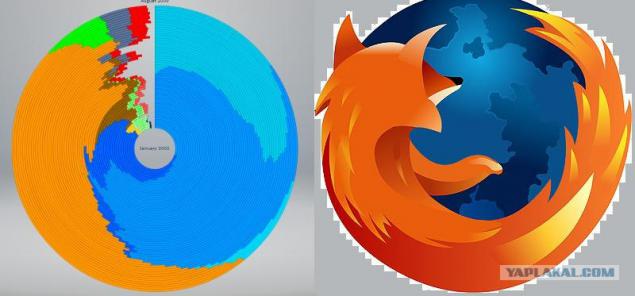
If you use browsers to display statistics from January 2002 to August 2009 at a pie chart, you can uglyadet something interesting. Perhaps similar to the ships: the browser will draw - so he take over the world?
2 Picchu.
Statistics w3schools.com
chart www.axiis.org
2.
Source:
2 Picchu.
Statistics w3schools.com
chart www.axiis.org

2.

Source: