4398
9 Most Important Trading Patterns

Trading patterns for traders are templates that allow stock traders to predict market quotes.
They arose and began to be used when it became possible to monitor the movement of asset values on monitors and build charts.
This element of technical analysis provides traders with a huge amount of information and exists in more than 100 variants.
Pattern is the basis for various trading strategies.
The article is devoted to the most common graphic figures on the chart, how to find and use them.
Learn about the most important Forex patterns - the main figures of technical analysis. Read right now!
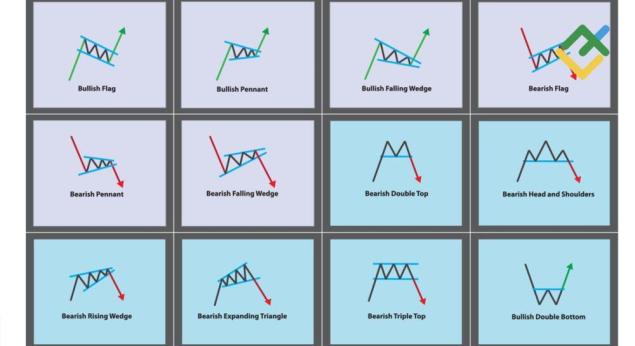
What are patterns in trading?
The market is cyclical, there are similar trading situations and the same type of events. These repeating patterns can be used in trading.
Patterns in trading are repeating elements in the figures on the chart, which are formed in connection with price changes. This allows you to predict the future direction of the trend.
The signals on the charts are clear, systematic and suitable for market analysis without additional tools.
Understanding chart patterns helps in developing trading plans, saves effort, time, and money.
Types of patterns in trading
Patterns come in two main types:
- Continuation of a trend, when prices continue to move in a certain direction.
- Reversal , indicating a change in direction and correction in the value of the asset.
Consider the most popular formations.
1. Double top
The figure is formed from two approximately equal price peaks with a minimum between them. The formation occurs during an upward movement, after which a downtrend is predicted. Then it is necessary to sell on short positions.
It is important to see the patterns in the chart: after the first high, the price retreats, and then forms a second jump.
2. Double bottom
The opposite, mirror version of the first figure, formed on a downtrend. Both low points mark the minimum of prices, and between them - a local maximum. It is after this point has been passed on the chart that a buy deal should be entered into. Then a price increase is predicted, when the asset can be sold at a higher price.
3. Head and shoulders
Figures of technical analysis in the form of a contour of a person - conditionally a head at the top in the center and two shoulders. A “neck line” is drawn through the points of minima connecting all elements. This pattern is easy to see, it forms at the highs of the price during an uptrend and belongs to the reversal type group. After the line passes through the right shoulder on the chart, the price falls. Selling should be done immediately after breaking through the “neck” level chart.
4. Inverted head and shoulders
The formation mirrors the previous one: a downtrend, formation at price lows. Here, after passing the neck line, you need to buy an asset. Look to enter the market when the candle closes above the neckline and the pattern is fully formed. Then you will avoid false breakdown.
In both previous cases, trading is based on the logical movement of values.
5. Triangle
Represents two lines intersecting at the end. Visually, they form a triangle, within which the price moves.
Patterns for a trader in the form of a triangle have three modifications.
— Equilateral personifies the continuation of the trend and market consolidation. Both lines - support and resistance - are inclined at an equal angle and converge at one point (top). The price is traded inside the figure. If you break above the resistance line, you should buy, if you break below the support line, you should sell.
— Rising — bullish forex pattern, indicating the price movement upwards. One of the lines on the chart is a straight horizontal line - resistance. The second plays the role of support and moves from the bottom up. As a rule, the resistance line breaks through. Then you should buy.
- Downward, on the contrary, gives a bearish signal for a fall in value after a breakdown below the support line. Here it is a horizontal straight line, and the resistance line is sloping from top to bottom.
6. Wedge
The figure, as it were, squeezes the fragment in the figure on both sides with lines where the price can fluctuate. Movement can pierce the features in any direction. If the breakout is below the support line, you need to sell. If it is above the resistance line, buy. The pattern is referred to as reversal patterns.
7. Rhombus
A rare trading reversal format, formed in any long-term trend. The rhombus at the maximum price indicates the end of the ascent, it is necessary to sell. The formed figure at the bottom of the chart is a buy signal.
8. Rectangle
Both lines are parallel, they show the range of price movement until one of them breaks. Everything is logical: a break above the resistance line, therefore, a purchase. Below the support line is selling.
9. Flag
Patterns in Forex in the form of a flag are a stable formation of the continuation of the existing market trend. Visually, it consists of a “pole” with a strong movement of value and a “panel”, where a dynamic corridor is formed, directed to the side between the two lines. In shape, it can resemble a triangle, wedge, rectangle. Going beyond the resistance line is a call to buy.
Conclusion
Pattern helps to work in the market consciously, with a great deal of confidence in your actions.
A trader with a clear understanding of the figures on the charts makes the right decisions that increase profits. Knowing the most successful chart patterns is the key to successful trading.
It takes practice to determine the formats on the graphs. We recommend using other approaches of technical analysis at the same time to complete the picture.
For more details, you can read the topic on the Gerchik website, which offers a large amount of information and advice from professionals.
I'm just mixing everything up, honey on kefir grows in the oven itself.
Only 60% of those surveyed saw which baby was a girl.

