1079
Machine synesthesia: audioanaliz using image processing algorithms
30,003,459
If you just want to look at the code for Python, follow the repository at GitHub .
For the preparation of the materials used IPython Notebook. You can download it on the ссылке.
Audioanaliz using image processing algorithms h4> graphics processors were designed with a single purpose - to simulate the physical properties of light, but now we use them for a variety of others, a variety of tasks. Is it possible to use image processing algorithms outside the usual area? Why not use them for signal processing?
Pre-processing of data h4> The audio data is represented as a one-dimensional array of discrete samples evenly distributed over time. Single-image is usually stored and processed as two-dimensional arrays, so I had to somehow introduce audio recording in two dimensions. The most primitive way - is just reformatted in a two-dimensional one-dimensional array.
We use the Fourier transform h4> Sensitivity to shift the time range can be reduced to a minimum, if you ignore the timeline and go to the level of the signal. This is done by using the Discrete Fourier Transform (DFT), and do quickly - using a fast Fourier transform, or FFT (If you need more information on the FFT and DFT, can see the post Vanderplasa Jake (Jake VanderPlas)).
The actual data h4> I want to make sure that my computer is able to determine which predetermined series episode is currently playing. As an example, I will use the 1 season of the animated series Adventure Time . I saved 11 WAV-files (one for each episode) in the subdirectory adv_time i>.
Let us ask the Nyquist h4> A man named Harry Nyquist showed us that the highest rate that we can reliably identify, equal to half the sampling frequency.
Conclusion h4> I was able to use image processing algorithms beyond their normal application. I got to create a good application, recognizing record. Perhaps it is realized not the best (I'm sure Shazaam uses a more efficient algorithm), but its creation has left me a couple of pleasant experiences. I have tried other methods using a comparison with a mask, for example, modulation Corner and SURF (see github ), but the classical approach was the most obvious and easy to perform. Further work may be directed to the study of other methods.
If you just want to look at the code for Python, follow the repository at GitHub .
For the preparation of the materials used IPython Notebook. You can download it on the ссылке.
Audioanaliz using image processing algorithms h4> graphics processors were designed with a single purpose - to simulate the physical properties of light, but now we use them for a variety of others, a variety of tasks. Is it possible to use image processing algorithms outside the usual area? Why not use them for signal processing?
To investigate this question, I decided to use the method of matching templates and images to determine the audio. Classic algorithms takes a picture and the template and return to any degree of similarity of the pattern portion of the image. My task was to identify the song into a database, which is part of the audio samples, using a method of comparing the mask (That's what makes Shazam or SoundCloud).
Pre-processing of data h4> The audio data is represented as a one-dimensional array of discrete samples evenly distributed over time. Single-image is usually stored and processed as two-dimensional arrays, so I had to somehow introduce audio recording in two dimensions. The most primitive way - is just reformatted in a two-dimensional one-dimensional array.
However, in practice this should be done cautiously. Let us assume that we started to capture audio from a source half a second after the beginning of records in the database - resulting two-dimensional arrays of these two entries will be very different. The two peaks are located nearby, can accidentally be on opposite ends of the sample.
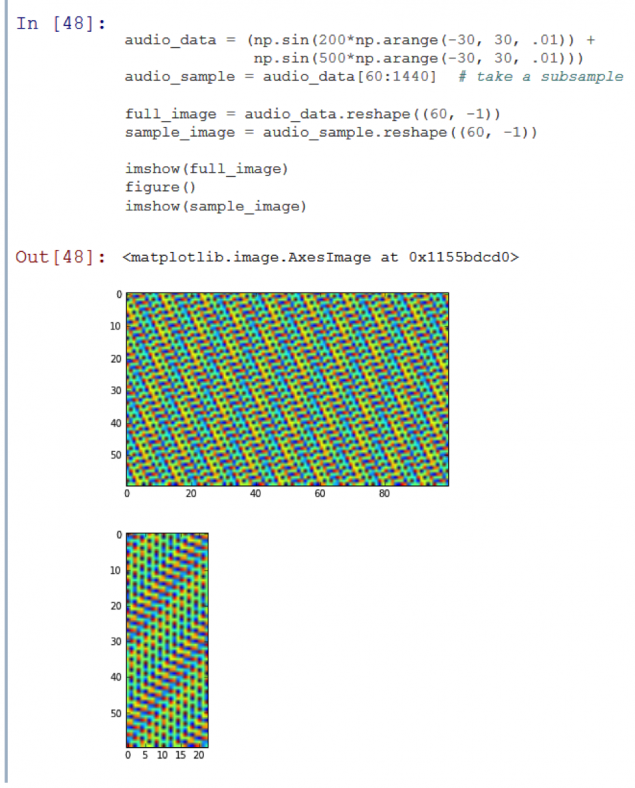
Obvious that the second image is a part (sub-sample) of the first.
A simple comparison algorithm with mask consistently puts the mask on the image and comparisons (where this has been a function match_template i> in skimage.feature i>). The algorithms employed in this way, will not be able to recognize the smaller image presented above for more.
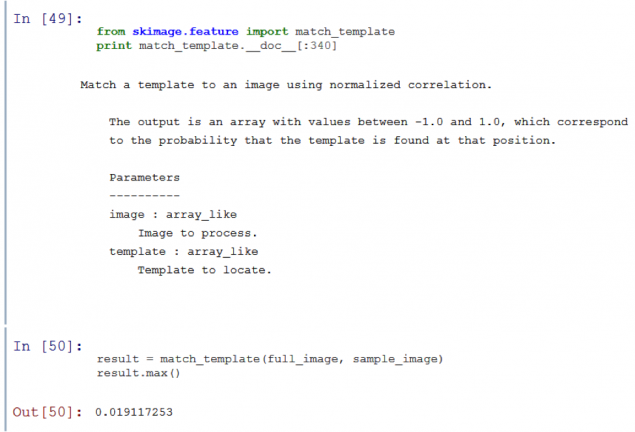
As you can see, match_template i> gives a very low chance of matching the template with any portion of the image.
We use the Fourier transform h4> Sensitivity to shift the time range can be reduced to a minimum, if you ignore the timeline and go to the level of the signal. This is done by using the Discrete Fourier Transform (DFT), and do quickly - using a fast Fourier transform, or FFT (If you need more information on the FFT and DFT, can see the post Vanderplasa Jake (Jake VanderPlas)).
If we apply the Fourier transform to each column reformatted our signal, we get an idea of how harmonics vary over time. It turns out that this is quite common technique widely used when creating spectrograms.
At its core, the Fourier transform tells us which of the frequency of the signal have the highest energies. Since harmonic audio usually change over time, then the spectrogram contains property time and frequency domains.
Let's look at the test sound spectrogram segment:
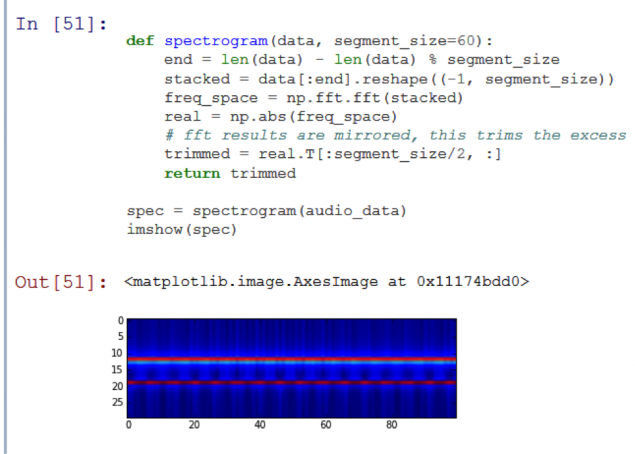
As you can see, the picture shows two horizontal lines. This means that audio consists of a set of two signals unchanging. It so happened, because the test record - is nothing more than the sum of two sinusoidal signals of different frequencies.
Now we have something like the image and, in theory, our approach works well with a subsample, displaced in time. Let's test our theory:

Success! The function match_template i> tells us that these two "images" have a strong correlation. However, if the algorithm works with the sound, which is something more than just a sum of sinusoidal signals?
The actual data h4> I want to make sure that my computer is able to determine which predetermined series episode is currently playing. As an example, I will use the 1 season of the animated series Adventure Time . I saved 11 WAV-files (one for each episode) in the subdirectory adv_time i>.
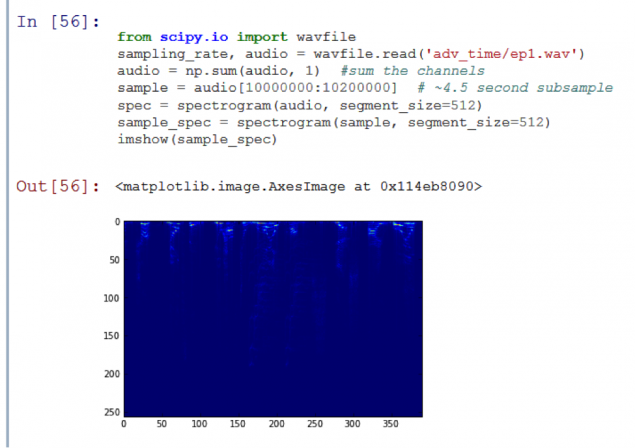
On the resulting graph peak appeared! The function match_template i> to define exactly what sub-sample is part of the original audio track. However, comparison of the algorithm took 20 seconds too long. To speed it up, we need to "lose" some data.
Let us ask the Nyquist h4> A man named Harry Nyquist showed us that the highest rate that we can reliably identify, equal to half the sampling frequency.

The sampling rate of 44.1 kHz means that we can determine the audio frequencies up to 22 kHz. This is sufficient, as the human ear perceives frequencies within only 20 kHz .
However, in the spectrogram above it shows that practically all the data of interest are in the upper half, and the largest number of - in the top eight. It seems that the scope of useful information contained in the soundtrack Adventure Time, even close to the upper limit of human perception. This means that we can produce a resampling step 8, and not lose too much important information.
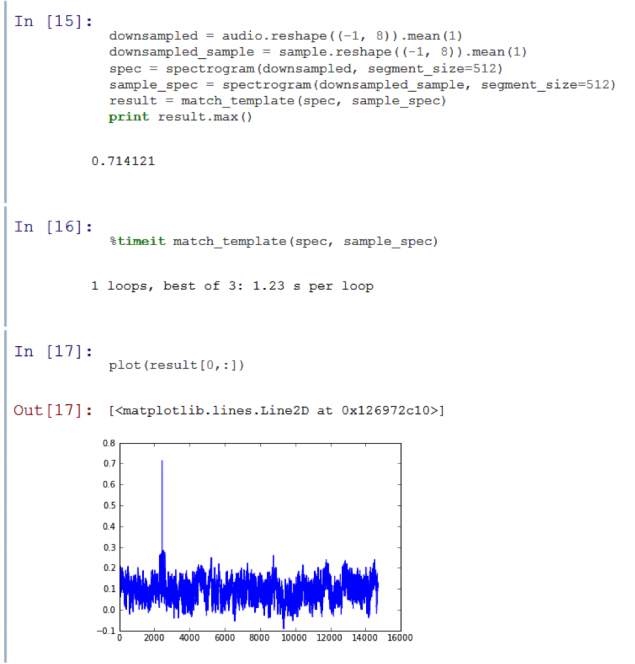
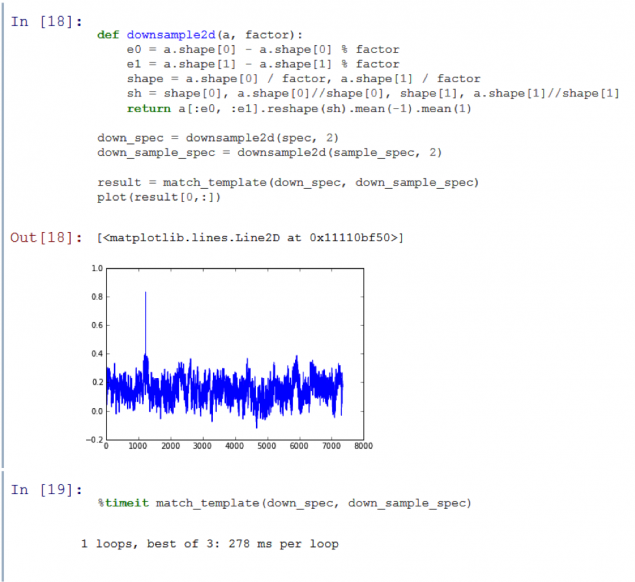
Much better. Down Sampling speed up function 15 times, while still giving a clear signal to background ambient noise, which is 71%. However, I want to further accelerate the process, re-cutting the amount of data. If we spend more time on the sub-sampling time, then we begin to lose an important high frequency information. But it is possible to carry out quantization.
We once again have accelerated to 4 times, still maintaining a good signal / noise ratio! I am quite pleased with the speed of the algorithm. Now I can make a comparison sample with a two-hour five-second audio track in less than a second. But there was one last test. So far, we have used a subsample carved out records from the database. I need to understand whether the algorithm samples, recorded using a microphone.
The result of the experiment is presented after the code below. First, I have prepared an audio track of each episode, and keep them in the directory store i>. I then used the pyaudio on his laptop to record the sound of Adventure Time episode from the TV.
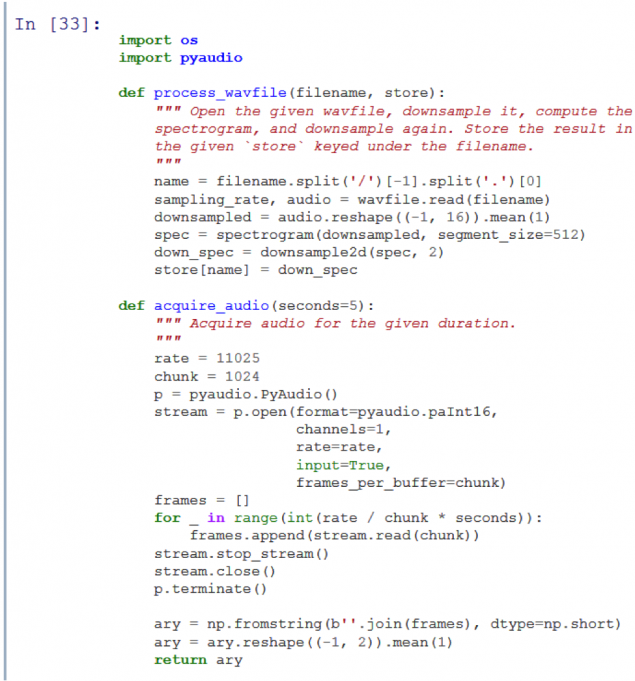
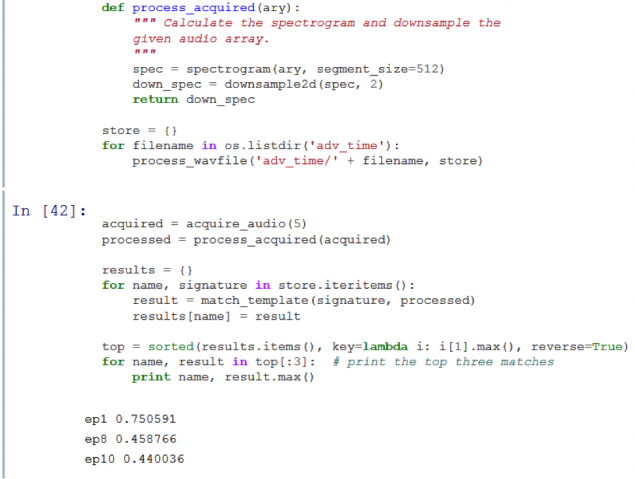
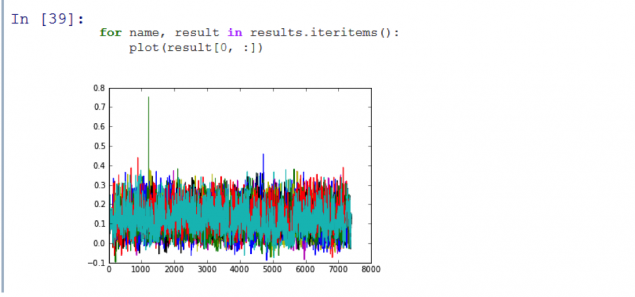
It works! As you can see, on the resulting graph shows a peak, which means that the program is correctly recognized the first episode of the season. I wrote the code was able to identify the first 11 episodes of the series Adventure Time with sufficient accuracy and in less than 3 seconds.
Conclusion h4> I was able to use image processing algorithms beyond their normal application. I got to create a good application, recognizing record. Perhaps it is realized not the best (I'm sure Shazaam uses a more efficient algorithm), but its creation has left me a couple of pleasant experiences. I have tried other methods using a comparison with a mask, for example, modulation Corner and SURF (see github ), but the classical approach was the most obvious and easy to perform. Further work may be directed to the study of other methods.
I did not write clean code, effectively using the computer's memory, and I think that it is possible to squeeze out a lot more performance. In addition to issues relating to the work with memory, these algorithms are still many problems to be solved - I did not spend a lot of time optimizing. Further work may reveal all the beauty of sub-sampling time and frequency. I would also like to experiment with the length of the sample and its undersampling.
I would like to test the reliability of the algorithm to work with different sources of audio. Held me down sampling was not tied to a specific type of audio used me, but could spoil everything if you connect another audio source.
All the code is available at github .
Source: geektimes.ru/company/audiomania/blog/251144/
As the Internet is not working - yellow pages instead of modern tools
Not rich Californians receive free solar panels


