2347
Earth from Space: 15 amazing things for 15 years
In December 1999, NASA launched a satellite, which opened a new era in our ability to see, measure and understand the Earth. The satellite, called Terra , was launched into space 18 December 1999 (it was designed for a 5-year research mission, but Therefore continues to collect invaluable data about the land, atmosphere and ocean). In 2002 and 2004, followed by Terra launched two new satellites, called Aqua and Aura. They are often called the three major satellites of NASA Earth Observing that seriously started with Terra and now includes a fleet of 18 satellites. They have revolutionized the ability to observe our planet from space.
NASA, as well as other space agencies to launch satellites to study the Earth before. But the last 15 years have produced a more comprehensive view of the Earth from space than any other period in history. At a time when our planet is undergoing critical changes, this global view not only offers stunning pictures, but also vital information about how to change the Earth.
To celebrate 15 years of successful operation of the system of Earth observation, NASA collected 15 impressive and interesting images , collected three orbiting satellites NASA.
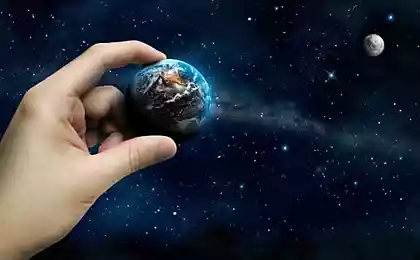
1. Blue Marble 2002 (Blue Marble 2002) h4> Get a complete picture of the Earth from space requires a complicated sequence of actions. In 1972, the crew of "Apollo 17" took to the moon the camera to get a shot with a complete picture of the Earth's field of view. In 2002, NASA scientists and visualizers stitched together the results of many months of observations of the Earth's surface, oceans, sea ice, and clouds in the true-color mosaic without joints using hyperspectral system MODIS (Moderate-resolution Imaging Spectroradiometer - Moderate Resolution Imaging Spectroradiometer) - an instrument aboard Terra. They added a layer of clouds to create the final composition Blue Marble , which has become one of the most iconic images of the Earth of the new century. In 2007, Apple chose Blue Marble as the default background for the iPhone. Version MODIS Blue Marble is currently used as a base layer for many data visualization NASA Earth.
2. The destruction of the ice shelf h4> Ridge runs up the spine of the Antarctic Peninsula, while the ice shelves flank it on both sides. Since the beginning of 2002, for several months, the tool MODIS aboard Terra watched one of the moments of destruction and disappearance of ice shelves, giving scientists and the possibility of the world from a bird's flight watch this dramatic event. In January, the surface of the Larsen Ice Shelf went rippling , began to form clusters water from the melting ice. In mid-February, the leading edge of the ice shelf retreated about six miles, and large icebergs break off and float away began to far out to sea. March 7, 2002 shelf was already completely destroyed.
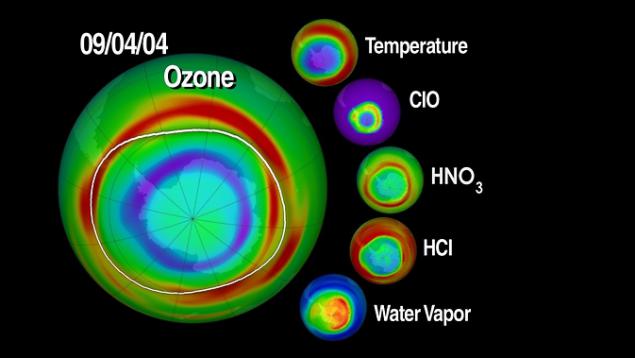
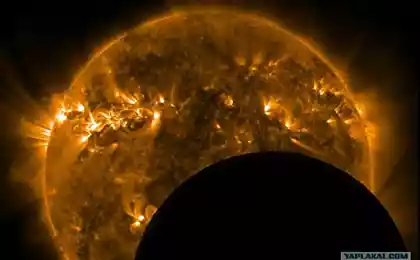
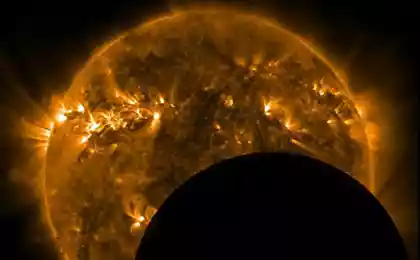
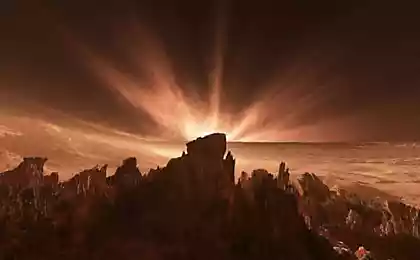
3. Ozone measurements at the edge of the disk h4> gas detection of ozone molecules, determine their location in the atmosphere requires going beyond the edge of the disk of the Earth. From orbit, the Earth's limb seems fuzzy blue halo that shines above the surface. Tools such as Microwave Limb Sounder (MLS) on board the satellite Aura possible to observe the edge of the disk of the Earth. As a result, we study the Earth's atmosphere side view, to the point where it is thinned out into space. This perspective allows scientists to measure the chemical composition of the Earth's atmosphere layer by layer. It is important to monitor the gases that contribute to the formation of holes in the ozone layer, and for evaluating the impact of clouds - climate change. With the Microwave Limb Sounder were first measured all the cosmic gases that are involved in the cycle of destruction of the ozone layer, giving scientists the first data, with which you can simulate the entire process of destruction of the ozone layer.
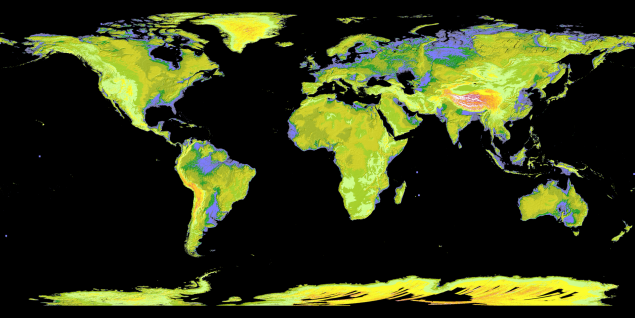
4. Global cycle of vegetation h4> from satellites can get pictures of the Earth, showing where grow trees and plants. But data from satellite instruments can tell us even more information, such as how much carbon dioxide is absorbed by plants from the atmosphere during photosynthesis. Hyperspectral system MODIS on board Aqua and Terra measure carbon sequestration, which allows scientists to compare the productivity of plants around the world. Animation shows this cycle throughout the year, reflecting the seasonal rise and fall of green vegetation on the planet. Dark green colors show higher rates of carbon sequestration.
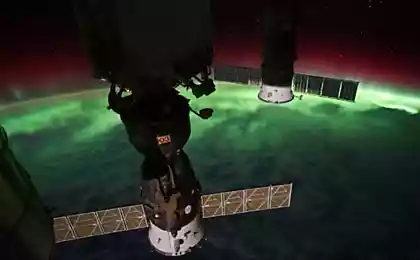
5. Arctic warming h4> The main reason for reduction of summer sea ice in the Arctic - a loss of white reflective surface that reflects the sun's energy back into space. Therefore, the ice melts and exposes the dark ocean water, which absorbs solar energy, potentially causing warming in the Arctic, where the temperature increases two to three times faster in recent decades than anywhere else on the planet. CERES (Clouds and the Earth's Radiant Energy Systems) - an instrument aboard the Terra and Aqua, which continues to measure the amount of solar radiation absorbed by the Earth since 2000. In the Arctic, this figure increased by 5% - a number that may not seem like a lot, except that the absorption rate remained virtually unchanged in the rest of the world, and no other region on earth showed no such changes.
6. Pure breath in the US h4> We can surprise the fact that in many parts of the United States air quality has improved in recent years. As new vehicles, strict rules on emissions control on the roads. At the same time, industry and power plants adhere to stringent restrictions on pollution. Some of the major pollutants that can cause health problems dropped significantly over the past 15 years. In recent years, NASA scientists figured out how to measure the concentration of a pollutant - nitrogen dioxide, using the tool OMI on board the satellite Aura. See visualization showing how air quality has improved in the United States from 2005 to 2011.
7. Burning planet h4> Each year, about a third of Earth's land surface is touched by fire. We did not know this fact until MODIS, instrument aboard the Terra and Aqua, has not started to scan the Earth four times a day in order to identify each fire point on the planet. In the fifteen years since the establishment of the global fire maps, they watched more than 40 million active fires. Map has played a revolutionary role in the scientific understanding of where fires occur and how they affect the ecosystem. It was found that the gas is released into the atmosphere, contributing to climate change, poor air quality, and it affects human health. In real time, fire card is one of the most popular products to fight forest fires in the United States and around the world.
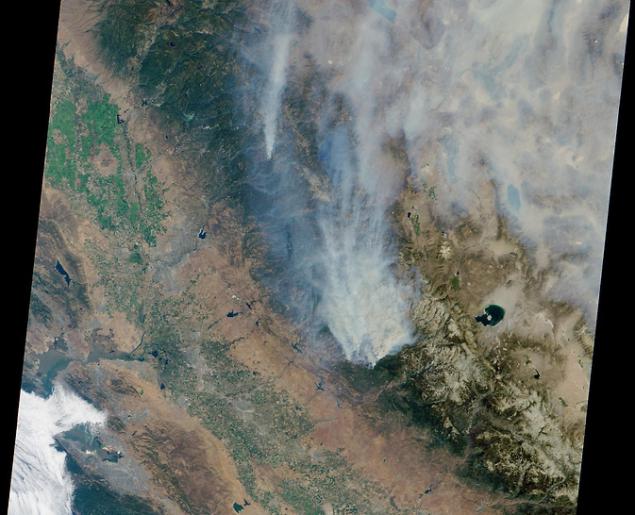
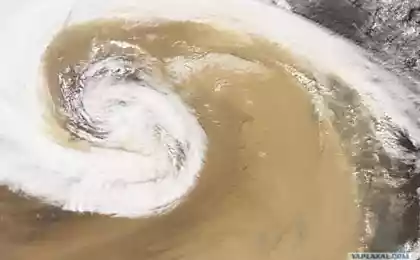
8. Smoke plumes from space h4> Sensors onboard Terra and Aqua satellites can not only detect heat from forest fires, as well as to "calculate" the number of active fires around the world at any time. They provide snapshots of active fires and smoke plumes to measure their. Perspectives on fire from space are now commonplace, but sensors in addition provide real data scientists about how far the smoke spreads from the source, and how high rises in the atmosphere. MISR (Multi-angle Imaging Spectroradiometer) instrument on board the satellite Terra, was instrumental in getting more information about how wildfire triggers smoke plumes; as smoke plumes penetrate the upper layers of the atmosphere; as plumes of smoke mixed with clouds.
9. The movement of sea ice h4> Aqua was not the first satellite, exploring sea ice from space. But using it for the first time were obtained high-quality data that allow scientists to see the ice cover of the Arctic (floating layer of sea ice more than the entire continental US) move and change from day to day. Summer sea ice shrinks and expands in the winter - and every day during this cycle, it takes many forms. With the tool AMSR-E aboard the Aqua can be seen as a beautiful sight.
10. Fluctuations in the amount of carbon dioxide h4> Ground sensors show that in the northern hemisphere, the concentration of carbon dioxide in the atmosphere increases and decreases depending on the time of year. This cycle is associated with the photosynthetic activity of plants, trees and phytoplankton. But without a global view of the satellite, we would never see a picture of how these fluctuations will look. Tool AIRS aboard Aqua measures the concentration of carbon dioxide at a distance of a few thousand feet above the surface. And visualization of these data gives an idea of how greenhouse gases are distributed worldwide, and their concentration varies depending on the season.
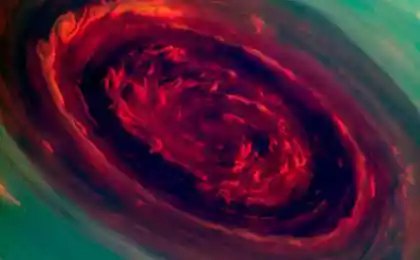
11. Secrets of clouds and aerosols h4> I still do not study the effect of clouds on climate change and small suspended particles called aerosols. Some clouds reflect the sun's rays, while others absorb them. Some aerosols scatter light and cause a cooling effect, and absorb light of other and cause the heating effect. Aerosols can also dissipate the clouds, further complicating the picture. Scientists used the MODIS instruments on the Terra and Aqua to begin continuous long-term observation of clouds and aerosols, which ultimately will help the scientific community to better understand their secrets. In recent years, other satellites were launched NASA (in addition to the Terra and Aqua) to explore additional types of clouds and aerosols by means of various types of instruments.
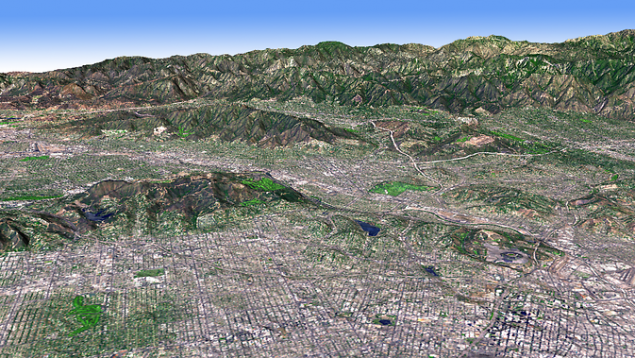
12. Topographic maps h4> Researchers have long moved forward and mapped the area previously uncharted territories, making detailed topographic maps of mountains, rivers, hills and plains. Global Digital Elevation Model ( Global Digital Elevation Model ), produced an improved satellite radiometer thermal emission and reflection ( ASTER - Advanced Spaceborne Thermal Emission and Reflection Radiometer), instrument aboard Terra, brings it to a whole new level. ASTER collects pairs of images with slight displacement of the Earth's surface. Small displacement images provide information about the depth and allow scientists to visualize the terrain of the Earth in 3D. The first global digital elevation model was released in 2009. It was a cross-linked with 1, 3 million scenes of the earth's surface. Have never been able to reach such a large number of fragments. It was a topographic map with the highest resolution, which covered 90 percent of the Earth's surface. Scientists use data on the topography to understand how the Earth changes over time, especially from natural disasters such as landslides, earthquakes, floods and tsunamis.
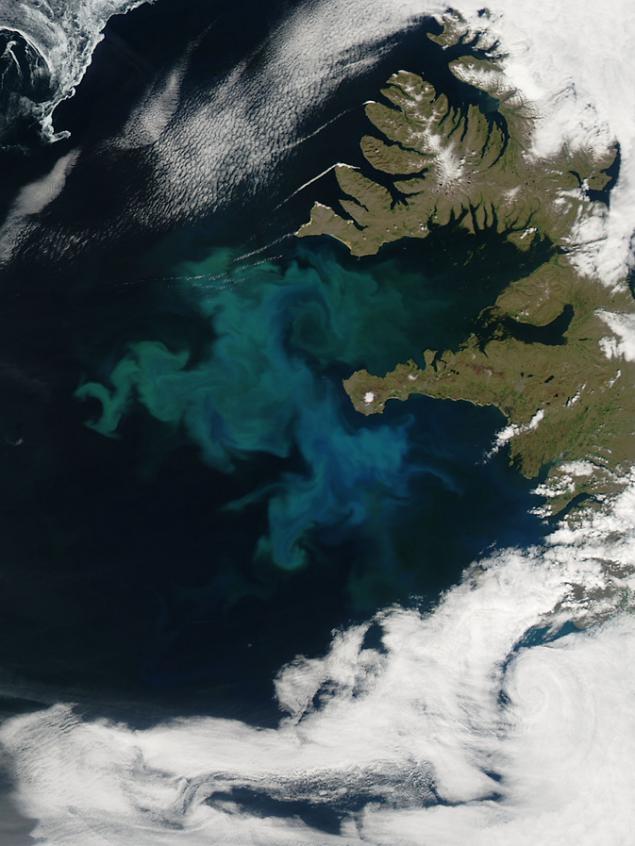
13. Dance plankton h4> When the tiny plants begin to bloom in the ocean, they extend for hundreds of kilometers. Worldwide phytoplankton bloom is about half of all photosynthesis on Earth and are the main element in making carbon from the atmosphere and transfer it into the ocean. With a huge number of blooms of phytoplankton to fish and marine mammals that feed on this kind of food, gather in one place, and this fact indirectly support their population. Daily observations of ocean color using MODIS instrument aboard the Terra and Aqua, scientists have dramatically changed the understanding of complex biological and physical relationships between phytoplankton, marine ecosystems and the global carbon stock.
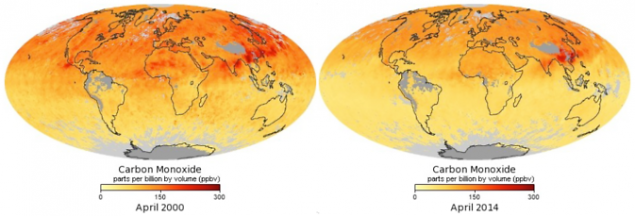
14. Displaying CO (carbon monoxide) h4> Carbon monoxide is a pollutant is colorless and odorless, the image of the fires, exhaust pipes of vehicles and other anthropogenic sources. Once in the atmosphere, the pollutant contributes to smog formation, sometimes thousands of miles away from the place of the original appearance. Carbon monoxide is a part of the ingredients for ground-level ozone - harmful pollutants. Aboard Terra has MOPITT instrument for measuring pollutants in the troposphere. MOPITT was the first device to trace the source of carbon monoxide worldwide. According to data collected from devices MOPITT, AIRS, as well as from data collected from European satellites, scientists have discovered that carbon monoxide emissions are reduced at a rate of 1% per year since 2000.
15. Recovery of the ozone layer h4> The Montreal Protocol of 1987 prohibits the use of ozone-depleting substances. It was a landmark moment for the international community, prompting come together and solve a serious environmental threat. The ozone layer in the stratosphere acts as a sunscreen for the Earth, protecting all life on the surface from harmful solar radiation. Satellite measurements of stratospheric ozone was important to monitor the seasonal occurrence of the ozone hole over Antarctica. Continuing measurements started satellites NOAA, OMI instrument on the Aura satellite has seen some signs that indicate that the hole in the ozone layer are on the road to recovery.
NASA, as well as other space agencies to launch satellites to study the Earth before. But the last 15 years have produced a more comprehensive view of the Earth from space than any other period in history. At a time when our planet is undergoing critical changes, this global view not only offers stunning pictures, but also vital information about how to change the Earth.
To celebrate 15 years of successful operation of the system of Earth observation, NASA collected 15 impressive and interesting images , collected three orbiting satellites NASA.