2272
Smyshlёnye stop
Today we have an unusual occasion to share our experiences with habrosoobschestvom. It is no secret that most of the projects and products that we create a live "virtual" world, and we can not always be traced back to the beginning and the end of all that we do work in real life.
The project, which we want to tell you we got a code and a bit of a funny name "Smyshlёnye Stop."

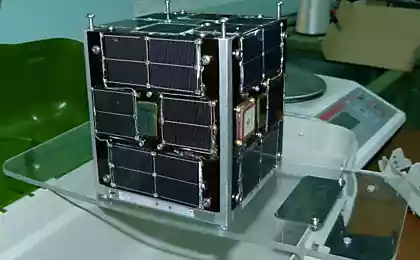
So, what are - in the city of "H" is the urban transport which established a tracking system based on sensors GLONASS data moving flock to the central dispatching service in the form of a steady stream of reports from these same sensors. I would like to place a stop on a liquid crystal panel that will show when and what vehicles running on routes to arrive.
The idea sounds simple, and to realize it's all there - the schedule of routes, routes themselves, sensors and information from them, the coordinates of stops, vehicles, published in flight. The case for small - to gather it all in one pile and get to work.
This is what we want to tell you today as the protocol to communicate with the sensors we reached the assembly of iron for smart stop and showed a working prototype at the show TECHNOPROM 2014.
Let's start with the fundamental architecture of the system, and then go over the details.
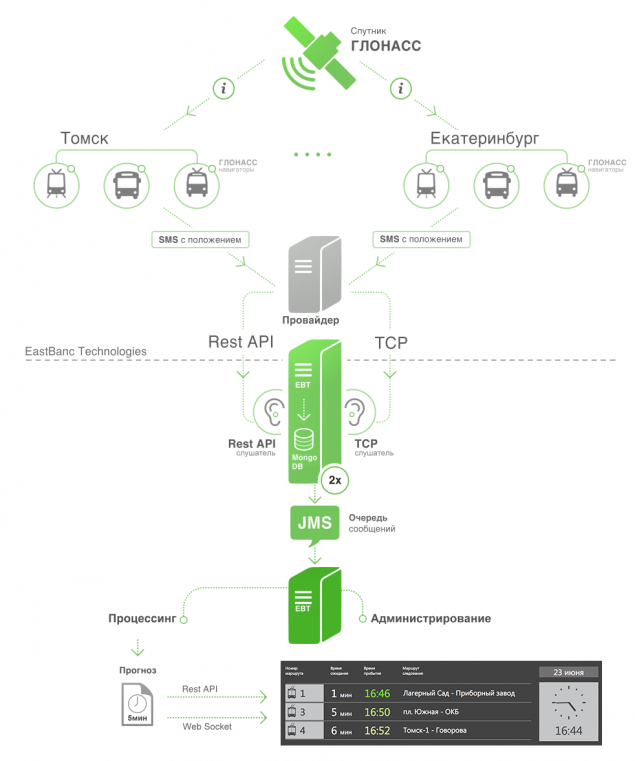
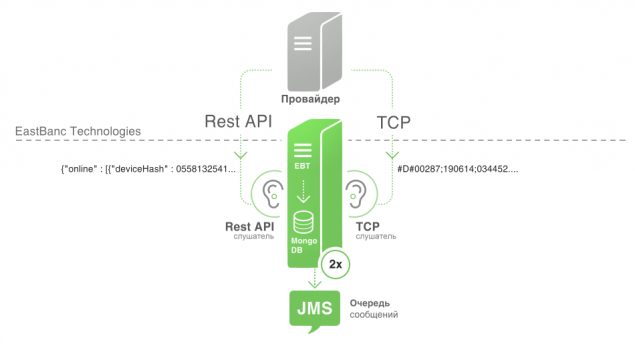
Collect data in real time h4> There is currently no single system or standard of operational data. In different cities of different providers that use different methods of distributing data in different formats and content. At the moment, we are faced with two: the transmission of data over TCP and REST API on the side of the provider.
For REST API - Spring-WEB
Positioning the vehicle on the route.
Gathering statistics passage of the vehicle segments.
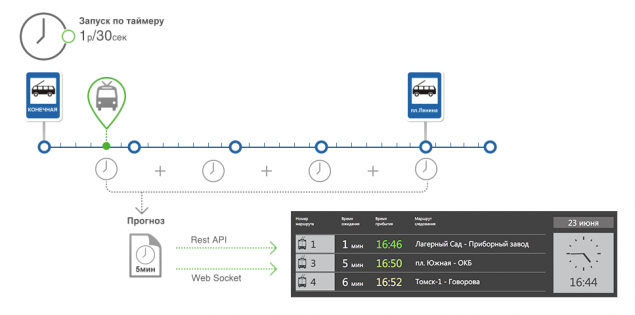
Construction of the forecast arrival at the stop.
The algorithm h4> of the algorithm can be divided into the following parts:
Positioning the vehicle to the route and determine the state of the vehicle The calculation of statistics passage route segments and calculating the actual time of transmission segments of the route The definition of arriving at a stop and the calculation of prediction error < / Create the forecast
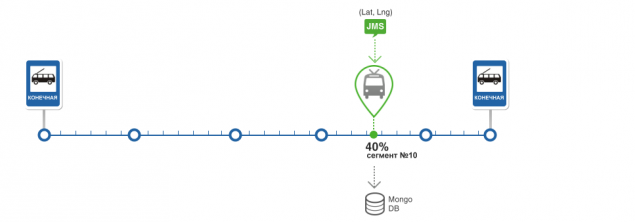
determine the position of the vehicle on the route and determine the state of the vehicle h5> In the preparation of navigation data runs algorithm for finding the position of the vehicle along the route. Position the vehicle consists of a segment of the route and the percentage of its passage and stored in the database along with the vehicle.
Get the details about the route and the vehicle from the database. If the vehicle does not exist, create it Search for route segments at a predetermined distance from the current position of the vehicle. The search is performed using the operator MongoDB - near For each segment is computed angle between the movement of the vehicle and a motion vector for the segment. If the difference of these angles is minimal and if it does not exceed a certain error, the system considers that the desired segment found For the found segment calculated the percentage of passing. For this is the projection of the position of the vehicle in the segment, and the percentage is calculated from the beginning of the segment to the projection. Once the segment on which the vehicle, determines the state of the TC. There are four initial state, of course, the outlook is unclear. The initial and final match first and last segments of the route. Forecast - means that the position of the vehicle is determined. Unknown - if the segment was not found. All states are used to construct the forecast and the calculation of statistics
Statistics calculation passage route segments and the calculation of the actual travel time of the route segments h5> The basis of the algorithm is a statistic.
Winter, summer, off-season Weekday and weekend Every hour starting from 6:00 to 21:00
The system is self-contained and works as statistics increases and increased forecast accuracy.
The problem of accumulation of statistics is reduced to obtaining travel time route segment. This time is added to a suitable interval, taking into account the statistical weights. The rate of change statistics inversely proportional measurements. On the one hand will minimize the temporary deviations in the passage of the segments, the other to take into account the changed situation on the road in the long run.
Actual time of the segment - this is the last time measurement passage segment today. With the advent of a new day, these data are cleared.
Gathering statistics - this is the part that is poorly described in the documents, and this is the part that we have done at its discretion.
Our task - to get the passage of the vehicle segment. During the day the vehicle is stored each position on the route and time of receipt of data on the situation of the vehicle.
Vehicle route passes entirely, namely, turns on one of the end segments of the route. When we fix this fact, we will start the process of counting the passage of time segments of the route.
Having considered the segments and frequency of obtaining data, we have identified four situations:
Situation 1.
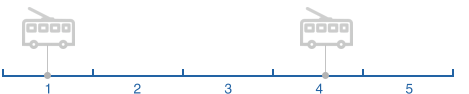
Situation 2.
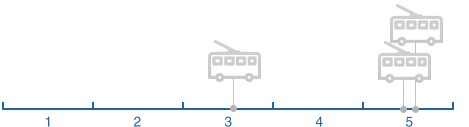
Situation 3.
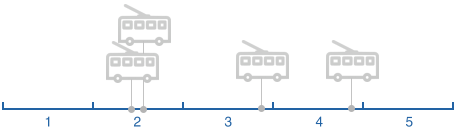
Situation 4.
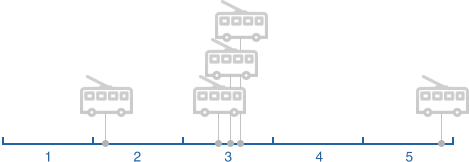
With multiple points of the vehicle and the position of each point of time, we can calculate how much time passed segment of the whole or part of it. Depending on the situation, we ignore some points of the vehicle position, for example, if more than one segment.
The definition of arriving at a stop and the calculation of prediction error h5> After determining the current position of the vehicle on the route is calculated for the next stop and the fact that the arrival of the vehicle to a stop.
Create forecasting h5> And then came the day when we have done all the pieces except the last. Actually, the establishment of the forecast.
At the entrance we have a route consisting of segments. For each segment, we know the statistical travel time and the last time the current passing. Statistics is selected based on the time of day, day of week and time of year. The last time the actual flow of each segment is used to minimize the error statistics.
The first step - to determine the nearest route for the vehicle to a stop, for him, we will build a forecast.
To do this, we choose a vehicle from the database, which is followed by a stop for which we do forecast. This takes into account the state of the vehicle as previously defined.
Each TC has a position on the route, namely the segment of the route on which it is located.
Each segment has a serial number of the vehicle while moving on the route. Choose from the list of the Customs Union, which has the serial number of the larger segment, it will be the closest thing to a halt.
The second step - to get a set of segments between the vehicle and stopping. As we already know the vehicle is on the segment, and each stop "knows" which segments adjoin. Thus, we have two segments and select the list between them.
The third step - count the time.
We summarize the current static and time of the segment between the vehicle and stop. The further segment from the stop, the more weight is the statistical time and vice versa, for close to a halt segments more weight at the time of passage of the current segment.
The amount of times this is the forecast when the vehicle comes to a stop.
As a result - we have a basis for an algorithm based on historical and real data [2] and in the implementation of its modified slightly to improve the accuracy of forecasting and here it is:

Now we have our own small control room! With the naked women and the construction site =).
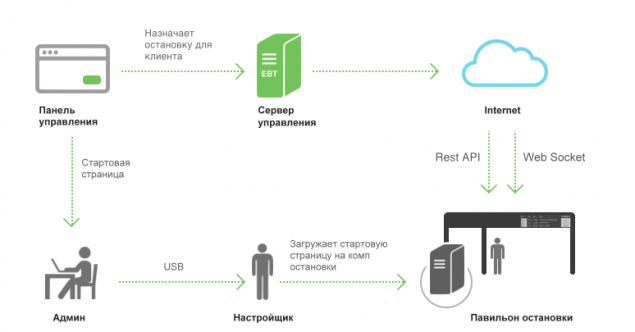
Manage scoreboard h4> We conceived the system as large and complex solution for networks of stops in different cities. Such a system can not work without the management and control.
The project, which we want to tell you we got a code and a bit of a funny name "Smyshlёnye Stop."

So, what are - in the city of "H" is the urban transport which established a tracking system based on sensors GLONASS data moving flock to the central dispatching service in the form of a steady stream of reports from these same sensors. I would like to place a stop on a liquid crystal panel that will show when and what vehicles running on routes to arrive.
The idea sounds simple, and to realize it's all there - the schedule of routes, routes themselves, sensors and information from them, the coordinates of stops, vehicles, published in flight. The case for small - to gather it all in one pile and get to work.
This is what we want to tell you today as the protocol to communicate with the sensors we reached the assembly of iron for smart stop and showed a working prototype at the show TECHNOPROM 2014.
Let's start with the fundamental architecture of the system, and then go over the details.

Collect data in real time h4> There is currently no single system or standard of operational data. In different cities of different providers that use different methods of distributing data in different formats and content. At the moment, we are faced with two: the transmission of data over TCP and REST API on the side of the provider.
An example of a package that we have on TCP
 & lt; code & gt; # D # 00287; 190,614; 034,452; 5628.0000; N; 8457.8226; E; 0; 272; 123; 12; gosnum: 3: 379, num: 3: 3 Troll & lt; / code & gt; < / pre>

 An example of a package of REST API
 & lt; code & gt; {& quot; online & quot; : [{& Quot; deviceHash & quot; : 0558132541, & quot; name & quot; : & Quot; bus H564VE96 & quot ;, & quot; timestamp & quot; : 1384710565, & quot; latitude & quot; : 50.65, & quot; longitude & quot; : 60.56, & quot; speed & quot; : 43.5, & quot; course & quot; : 120.1, & quot; sats & quot; 8, & quot; route & quot; : & Quot; 021-bus & quot; }, ...]} & Lt; / code & gt;  pre>

 The format and content packages:
- Device ID.
- The naming or identifier TA - number TC and type of the vehicle.
- Release time data.
- The latitude and longitude. < /
- Speed.
- course.
- The number of satellites.
- The ID of the route along which the vehicle.
Consider both options receiving data.
Roles and responsibilities listnera:
- Getting "raw" data from the provider.
- Parsing and processing data in a format understood by the system. From line, or from JSON in POJO.
- Forwarding received POJO data to JMS in a predetermined topic.
- Failover. To identify problems in obtaining data from the provider or the physical inaccessibility listnera, listner should send ping packets to JMS.
- Saving POJO after parsing in a separate database. Saving the raw data into a long week. This mechanism is made in order to be able to accumulate statistics of the algorithm is minimal. During the life of the system assumes completion and tailor the algorithm, and to be able to check changes in the algorithm, we store data. And they know how to play to accumulate statistics and evaluation of the algorithm after the changes.
In the case of TCP, we specify the host and port, and the data provider sends packets to that host. Then it comes in our listener TCP channel.
We used as a basis for TCP listnera Netty. It is very easy to use and stable in operation. In the case of REST API we used customer Jsoup, which polls api timer.
Listner itself, is a console application with the ability to specify the host, port and settings for JMS and database.
The process of working listnera:
- Getting data into the case with TCP or timer when REST API.
- Analysis of string or JSON, and create an object of class NavigationPackage.
- Sending NavigationPackage to JMS .
- Saving NavigationPackage the database.
- Send ping packet to JMS (object class PingPackage).
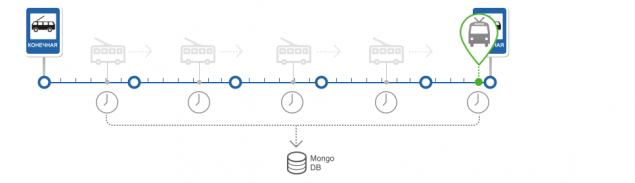
As a result every 30 seconds we fill our database of information about the actual movements of vehicles (hereinafter TC).
What we need to understand what's going on with that?
1. Segmented Routes.
2. Coordinates stops.
We took these routes and stops of GIS systems, to treat them in such a way as to obtain segmented routes
Well, now we know who and where is going, so it's time to start building the forecast. But before that, for the discharge at the numbers digress.
In order to get a better feel for how it all works show the number:
- 60 nautical packages we get from 8 trolleybus routes in a minute.
- 10 ms is the construction of the forecast for one stop.
- 600 ms it take to process a navigation pack on average.
- 500 segments , on average, the same route.
- 5 to 20 vehicles average en route to Tomsk.
- 168 stops in Tomsk for 8 trolleybus routes li >
- 159 hours for two people - that is how much time and so many people, we have implemented an algorithm entirely.
And of course, speed is very dependent on iron - all of the above data is removed from the test virtual machine.
Go ahead, choose an algorithm to implement it and to show results.
How to choose the algorithm. h4> As with any other time, we do not reinvent the wheel and try to realize that the available algorithms most suits us. I shoveled a lot of work is not Russian, and Russian scientists. In fact approach to forecasting is not so much, and all of the algorithms - a modification of the two or three major.
The first step selected several algorithms that seemed to us "easier." In fact, any of the basic algorithms have the same complexity in the understanding and implementation. All difference - in particular situations which may be considered, and can be omitted.
Our starting step was research Ran Hee Jeong [1]. Full list of works of literature, and we have given at the bottom of the article.
So, the first step we chose several articles and research papers on the algorithms within the team. On board each drawn and realized all the pitfalls and tried to assume as part of the work, not described in the article. Yes, not all can be found. In this case, the selected algorithms considered is forecast, but did not consider ways to collect statistics passing routes on which the forecast must be built.
The second step we had a brainstorming session in which tried to tell colleagues and explain the chosen algorithm. In total, this event was attended by seven people. According to the results, answering all the questions, we realized that we could implement the algorithm in a finite time.
Next trick. Analysis division into tasks, assessment and plan of work. By the way, after this preliminary work we've got to do a good evaluation and more importantly - we missed it.
What are the criteria for the selection algorithm h4> When selecting an algorithm tried to find a balance between the complexity of the implementation and results of the algorithms. As a result, the algorithm is based on historical data, a little loses algorithms based on neural network predictive accuracy, but it is easier to implement. We had a requirement to achieve the forecast with an accuracy of 30 - 60 seconds, which is quite acceptable for ordinary passengers.
The process of developing a processing server h4> A small digression on the technical part of the project to the side of doing such projects.
Among the conditions at the start we had one very important limitation, we had to get a working prototype to a certain number. It was connected with the exhibition TECHNOPROM 2014. And in the writing of the work plan we had to endure in the first part of the project development of the algorithm and the whole client. Without governance and other necessary things.
A good project for the customer, when he sees the progress of work as often as possible. And in our case we have a large part of the time was to leave for the implementation of the algorithm and its run-in.
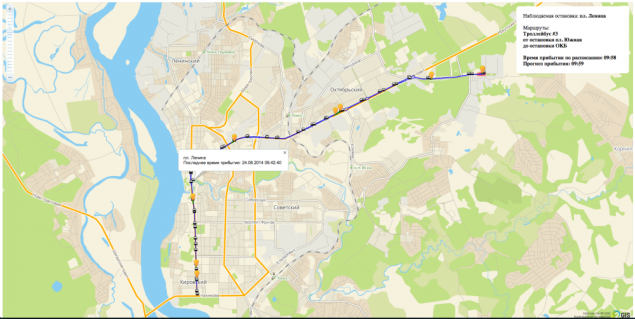
As a result, we decided to do a test bed for one route and one stop.
The test stand is html + js + webSocket. B>
During the development process we first appeared on the map and the route it. Then came the vehicles (TC) and update their status. Then the position of the vehicle on the route - a segment and the percentage of passing. Then, the timing of the arrival of the bus stop. Then the actual forecast and the last step was the development of the algorithm graph which shows the forecast error.
This approach made it possible for the customer "live" monitor the process of our work. Everything was very transparent.
Further detail on the technical part of the processing and the algorithm.
Job Processing Server h4> Originally, the design was supposed to have a separate server for each city.
The process of work and functions of the processing server:
- Getting data from JMS.
- Positioning the vehicle to the route and the state of the vehicle based on the navigation data.
- Calculate Statistics passage segments.


For REST API - Spring-WEB
Positioning the vehicle on the route.

Gathering statistics passage of the vehicle segments.

Construction of the forecast arrival at the stop.

The algorithm h4> of the algorithm can be divided into the following parts:
Positioning the vehicle to the route and determine the state of the vehicle The calculation of statistics passage route segments and calculating the actual time of transmission segments of the route The definition of arriving at a stop and the calculation of prediction error < / Create the forecast determine the position of the vehicle on the route and determine the state of the vehicle h5> In the preparation of navigation data runs algorithm for finding the position of the vehicle along the route. Position the vehicle consists of a segment of the route and the percentage of its passage and stored in the database along with the vehicle.
The algorithm works as follows:
Get the details about the route and the vehicle from the database. If the vehicle does not exist, create it Search for route segments at a predetermined distance from the current position of the vehicle. The search is performed using the operator MongoDB - near For each segment is computed angle between the movement of the vehicle and a motion vector for the segment. If the difference of these angles is minimal and if it does not exceed a certain error, the system considers that the desired segment found For the found segment calculated the percentage of passing. For this is the projection of the position of the vehicle in the segment, and the percentage is calculated from the beginning of the segment to the projection. Once the segment on which the vehicle, determines the state of the TC. There are four initial state, of course, the outlook is unclear. The initial and final match first and last segments of the route. Forecast - means that the position of the vehicle is determined. Unknown - if the segment was not found. All states are used to construct the forecast and the calculation of statistics Statistics calculation passage route segments and the calculation of the actual travel time of the route segments h5> The basis of the algorithm is a statistic.
The route is broken into segments, and during operation, the system collects statistics of the transit time for each segment. Each segment 90 has a statistical value.
Splitting the following:
Winter, summer, off-season Weekday and weekend Every hour starting from 6:00 to 21:00 The system is self-contained and works as statistics increases and increased forecast accuracy.
The problem of accumulation of statistics is reduced to obtaining travel time route segment. This time is added to a suitable interval, taking into account the statistical weights. The rate of change statistics inversely proportional measurements. On the one hand will minimize the temporary deviations in the passage of the segments, the other to take into account the changed situation on the road in the long run.
Actual time of the segment - this is the last time measurement passage segment today. With the advent of a new day, these data are cleared.
Gathering statistics - this is the part that is poorly described in the documents, and this is the part that we have done at its discretion.
Our task - to get the passage of the vehicle segment. During the day the vehicle is stored each position on the route and time of receipt of data on the situation of the vehicle.
Vehicle route passes entirely, namely, turns on one of the end segments of the route. When we fix this fact, we will start the process of counting the passage of time segments of the route.
Having considered the segments and frequency of obtaining data, we have identified four situations:
Situation 1.

Situation 2.

Situation 3.

Situation 4.

With multiple points of the vehicle and the position of each point of time, we can calculate how much time passed segment of the whole or part of it. Depending on the situation, we ignore some points of the vehicle position, for example, if more than one segment.
The definition of arriving at a stop and the calculation of prediction error h5> After determining the current position of the vehicle on the route is calculated for the next stop and the fact that the arrival of the vehicle to a stop.
We have implemented two versions of the algorithm arrival.
The first option in a nutshell - the vehicle came to a stop, if it is on a segment immediately before or immediately after stopping. And this option was not working =) The fact that various different stops along the length of the adjacent segments, and if the segment is too short, the navigation data simply do not fall into them.
The second option in a nutshell - the vehicle came to a stop, if it is at a certain distance from it. With complete MongoDB and geo codes, we had plenty of space to write the appropriate questions. The size of the polygon in which the list is selected based on the frequency of receipt of navigation data, i.e. we chose the size of the landfill to minimize its size and thus increase the likelihood that it will be the vehicle.
In both cases we have considered only the vehicle that are on the route, which identifies the segment.
The arrival of the vehicle to a stop is displayed on the scoreboard.
Having determined that the vehicle came to a stop, we expect the deviation from the forecast real time by the index of MAPE. More details about it can be found here .
Create forecasting h5> And then came the day when we have done all the pieces except the last. Actually, the establishment of the forecast.
A summary of the algorithm.
At the entrance we have a route consisting of segments. For each segment, we know the statistical travel time and the last time the current passing. Statistics is selected based on the time of day, day of week and time of year. The last time the actual flow of each segment is used to minimize the error statistics.
The first step - to determine the nearest route for the vehicle to a stop, for him, we will build a forecast.
To do this, we choose a vehicle from the database, which is followed by a stop for which we do forecast. This takes into account the state of the vehicle as previously defined.
Each TC has a position on the route, namely the segment of the route on which it is located.
Each segment has a serial number of the vehicle while moving on the route. Choose from the list of the Customs Union, which has the serial number of the larger segment, it will be the closest thing to a halt.
The second step - to get a set of segments between the vehicle and stopping. As we already know the vehicle is on the segment, and each stop "knows" which segments adjoin. Thus, we have two segments and select the list between them.
The third step - count the time.
We summarize the current static and time of the segment between the vehicle and stop. The further segment from the stop, the more weight is the statistical time and vice versa, for close to a halt segments more weight at the time of passage of the current segment.
The amount of times this is the forecast when the vehicle comes to a stop.
As a result - we have a basis for an algorithm based on historical and real data [2] and in the implementation of its modified slightly to improve the accuracy of forecasting and here it is:

Now we have our own small control room! With the naked women and the construction site =).