1391
How can trust sociological research?

reason of this writing, it was the research that discussed earlier .
With my higher technical education and love to the exact sciences, especially in mathematics, I appreciate and respect those theories that apply to life and provide added value (contrary to popular belief that the theory of relativity to do with everyday life has no worth to study the theory GPS- systems and fire rockets across the entire planet). Let us at this point look at a part of the statistics as opinion polls. They are now very fashionable.
We will try to look at it through the eyes of a man far removed from the formula.
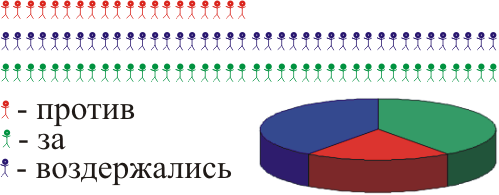
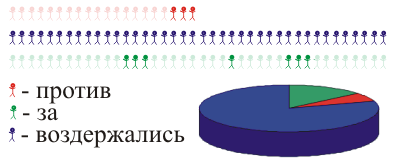
An intuitive understanding h4> We have a village where 100 people live. We want to figure out how to relate to the residents of this village have built chemical. Plant. For this purpose it is necessary to interview all 100 people - right? Of these, 20% against, 40% do not care, 40% for:
But - not all the inhabitants of the survey did not know. Polls Let us then some part - at least half.
You can do this: divide all the villagers for some groups: for example, freelancers who are employed and non-employed. From each group will take several people and get a репрезентативную sample :
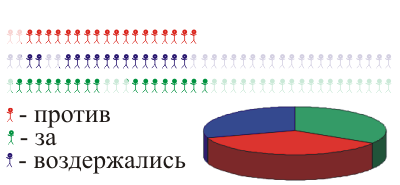
Or we proceed differently: dispersed at random, who caught that and caught. Counted half the village - and the order received вероятностную sample :
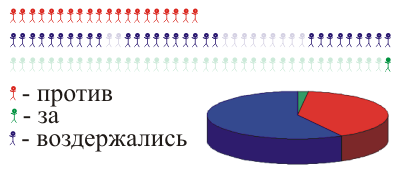
You can do more elegantly: a random number generator we select some of the street and go there. You can even divide the quota residents. In general, the act means невероятностной Sample :
So after all - the people "for", "abstention" and "against» ???
In this case, it is more or less obvious. But it is because we know full i> the result. If we Poll More than half i> citizens, we too can qualify for about the real i> knowledge. Or we can interrogate a small number of randomly selected residents many times - so that we interviewed a total of several times more i> inhabitants than they have in the village.


A common problem polls h4> In any poll it is necessary to be sure that questioned those who need it. For example, in the case of the survey most sexy women in the world not so terribly wrong. In any important issue - for example, the election of the President - is very important to weed out those who live there, mentally healthy and alive at least, all those who did not get into this category. You also need to be sure that everyone voted for myself once.
The second problem - the number of people who should be interviewed. If you take the average European country of 10 million people, or 1% - it is 100 000 people. Such conduct a survey paper method is practically impossible.
Once a reservation: paper i> hard, but e i> easier. But once there is a big problem weed out those who want to poll, and who do not need it.
On the other hand, a reliable paper survey this (and much more) can hold a population, but it requires a tremendous effort. A classic example - surveys called "referendum", "presidential elections".
The survey of Levada Center h4> Now back to the real survey who commented here :
The survey was conducted on 25-28 April 2014 on a representative nationwide sample of urban and rural population in 1602 among people aged 18 years and older in 130 settlements of 45 regions of the country. Distribution of answers given as a percentage of the total number of respondents, together with data from previous surveys. The margin of error data from these studies does not exceed 3, 4%
i>
What I understand from this without thinking?
1602 Interviewed person. Its population according to the results всероссийской 2010 Census of 142,856,536 rights. Divide in 1602 to 142 856 536 and we receive - 1.1 * 10 -5 sup>. This is 0.001%. Then, in a survey of 0.001% of Russians concluded by all Russians i>. Take into account that the interviewed people over 18 years old. For the same result, residents under 19 years of 28,026,172 people, or 19.6%. Well, subtract children: share in 1620 to 114 830 364. The result changed: 1.4 * 10 -5 sup>. This is 0.0014%. A significant difference? A survey conducted in 130 settlements. Based on the results of the All-Russia Population Census 2010 Russia it насчитывается 1100 cities, 1285 PGT and 153,124 villages - a total of 155,509 villages. Divide 130 by 155 509, and we get 8.4 * 10 -4 sup>. This is 0.083%. Then, in a survey of 0.083% in the settlements concluded in all settlements of Russia i>. The survey was conducted in 45 regions. At сегодняшний this day 85 of the region (including the Crimea Russia here). Divide 45 by 85 and get 52%. Then, in a survey of half of Russian regions concluded in all regions i>. «The margin of error ...» - какая it ? Relative to what? What were the conclusions follow? I think it's obvious ...
Is that the Levada Center incompetent so angry? No, this is a disaster of any poll in such a big country as Russia.
What are the other problems? h4> I will not repeat much - read excellent article on this topic. For the seed take a look at the graph of that article, which shows the number of private and public schools in the United States:
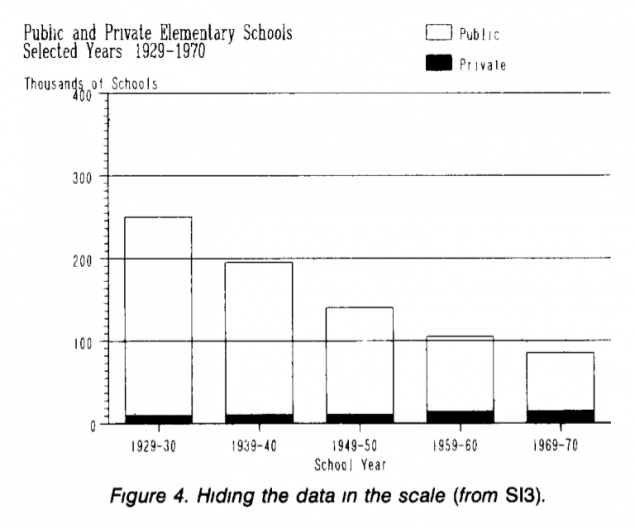
The graph shows that the public school is getting smaller, and does not increase private ... Stop! Watch carefully - and private-is black, it is more! Look at the chart, where the number of private schools is shown separately:
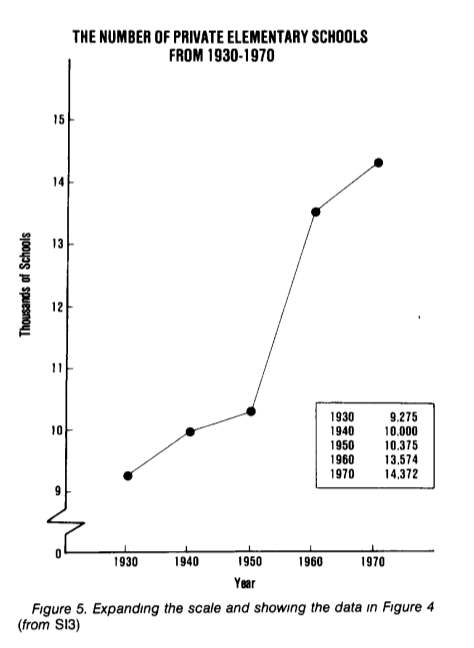
Nice, huh?
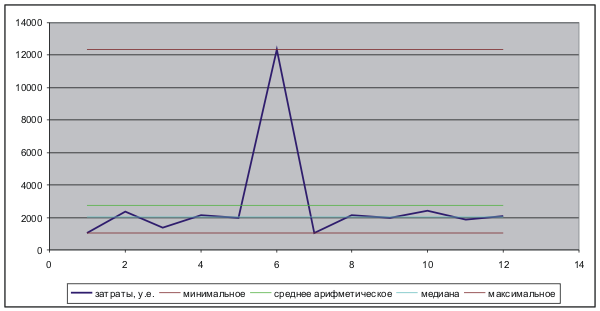
Now a small example of the personal life. Let's say I'm the statistics of your expenses. For a year I have received such costs:
month th> expenses from. e. th> January 1047 February 2354 March 1358 April 2123 May 1984 June 12346 July 1023 August 2136 September 1986 October 2431 November td > 1856 December 2113 I want to have deferred amount that will help me, if my income will fall sharply. I decided to analyze the table and decide for next year as I defer to average i> enough? The first thing I look at least - July, 1023. Then I look at the most a maximum - June 12346. So, I take the average of the minimum and maximum? Will (1023 12 346) / 2 = 6684. Is that reflects my spending? Scary exaggerated. 

Let's see otherwise - take the average of all the months - that we get 2729. This reflects my spending? Every month I spend less money here except in June to spend much more. Exaggerated.
Think of the медиане: Roughly speaking, in the distribution of the probability it will be An intermediate. In this case 2049. In half of the cases I have spent less in half more. The closest to the real situation. Question - Do you often met in opinion polls as a result of the median?
The downside of calculating the median - it considered more difficult than the arithmetic mean. Yeah, but in the age of n-core processors in the phone, this argument sounds strange i>.
The chart reflects these considerations.