1843
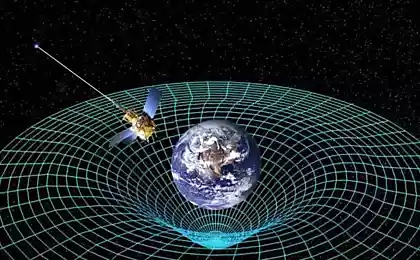
Displaying the gravitational forces of the solar system
Introduction h5> Often it is very difficult to explain in words the simplest things or device of a machine. But usually, the understanding comes easily enough if to see their eyes, and even better, and to twist in his hands. But some things are invisible to our sight, and even if just very difficult to understand.
For example, what is the electric current - there are many definitions, but none of them describes it exactly the mechanism, without ambiguity and uncertainty.
On the other hand, electrical engineering developed a strong science, which with mathematical formulas described in detail any electrical processes.
So why not show similar processes using these same formulas and computer graphics.
But now consider the action of a simpler process than electricity - the force of gravity. It would seem that there is complicated, because the law of gravity is taught in school, but nevertheless ... Mathematics describes the process as it takes place in ideal conditions, in some virtual space, where there are no restrictions.
In life everything is usually not the case and on the process in question is continuously applied a number of different circumstances, obscure or insignificant at first glance.
Know and understand the formula for its action - it is a little bit different things.
So, make a small step toward understanding the law of gravity. The law itself is simple - the gravitational force is directly proportional to the masses and inversely proportional to the square of the distance between them, but the difficulty lies in an unimaginable number of interacting objects.
Yes, we consider only the gravitational force, so to speak, alone, which of course is not true, but in this case is acceptable, as it is simply a way to show the invisible.
And yet, in the article is the code of JavaScript, ie All figures are actually drawn with the Canvas, so you can take the entire article here .
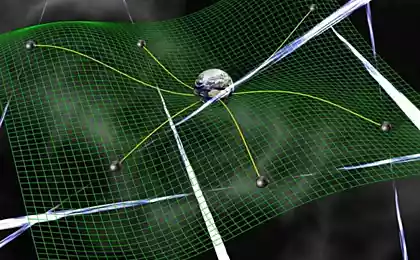
Display options gravity in the solar system h4> In the framework of classical mechanics the gravitational interaction is described by the Newtonian law of gravitation, which states that the gravitational attraction F between the particle of mass m < sub> 1 sub> and m 2 sub> , separated by a distance r , is proportional to both masses and inversely proportional to the square of the distance - that there:

where G - the gravitational constant, equal to about 6, 67384 × 10 -11 sup> n × m 2 sup> × kg -2 sup >.
But I would like to see the image change in gravitational force throughout the solar system, but not between the two bodies. Therefore, the mass of the second body m 2 sub> will take equal to 1, and the weight of the first body denote a m

Now, instead of m , we substitute a lot of interest to the body, and instead of r iterate over all distances from 0 to the value of the orbit of the planet and get the latest changes in the gravitational force, depending on the distance.
When applying the forces of different objects, whichever is greater in magnitude.
Next, we express this power is not in numbers, but in their respective shades of color. At the same time get a clear picture of distribution of gravity in the solar system. That is, in a physical sense, color tone corresponds to the weight of the body mass of one kilogram at the corresponding point of the solar system.
It should be noted that:
the gravitational force is always positive, not a negative, ie, weight can not be negative the force of gravity can not be equal to zero, ie, object or there is a certain weight, or does not exist the force of gravity can not be to screen or reflect (like the light beam of the mirror). (actually, that's all restrictions imposed by physics to mathematics in this issue). 

Let's now look at how to display color values of the force of gravity.
To show the number of colors you want to create an array where the index would be equal to the number and value is the color value in the RGB.
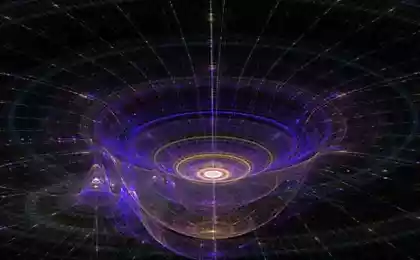
That gradient of colors from white to red, then yellow, green, blue, purple and black. A total of 1786 shades of color.

Number of colors is not so great, they just will not be enough to display the entire spectrum of gravitational forces. We restrict ourselves to the gravitational forces of the maximum - on the surface of the Sun and the minimum - in the orbit of Saturn. That is, if the force of gravity on the surface of the Sun (270, 0 H) denote color, are in the table at index 1, the force of attraction to the Sun in an orbit of Saturn (0, N 00006) will be color-coded with the index for 1700. So far that still is not enough colors for even the expression values of the gravitational force.
To make it clearly visible the most interesting places in the displayed power of attraction is necessary that the amount of force of gravity is less than 1H correspond to large changes in color, and by 1H and higher compliance is not so interesting - you can see that the force of gravity, say the earth is different from the gravity of Mars or Jupiter , yeah, okay. That is, the color will not be proportional to the force of gravity, or we "lost" the most interesting.
To bring the value of the force of gravity to the index color table use the following formula:
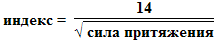
Yes, this is the hyperbole, known even since high school, only pre-argument of the square root. (Taken purely "from the lantern", only to reduce the ratio between the highest and lowest values of the force of attraction.)
See how to distribute the colors depending on the gravity of the Sun and planets.
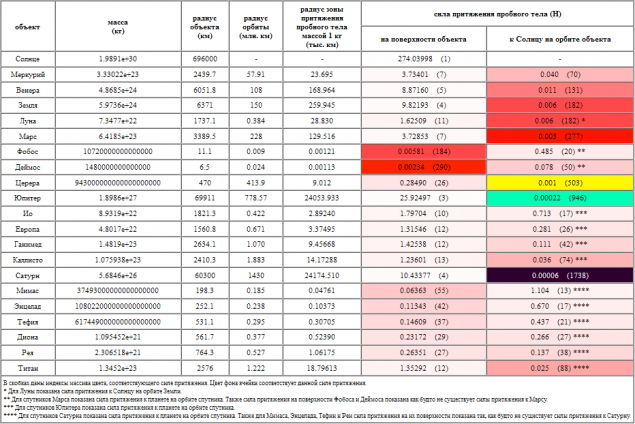
As you can see on the surface of the Sun, our test body will weigh about 27 274N or 4 kgs since 1 H = 0, 10,197,162 kg = 0, 1 kg. A Jupiter almost 26H or 2, 6 kg on Earth, our test body weighs about 9, 0 or 8H, 98kgs.
In principle, all these figures are very, very rough. In our case, this is not very important, we need to turn all these values the force of attraction to their corresponding color values.
Thus, the table shows that the maximum value of the attractive force is 274N, and the minimum 0, 00006N. That is, differ by more than 4, 5 million times.
It also shows that all the planets turned almost the same color. But it does not matter, it is important that the borders will be clearly seen the attraction of the planets, as the force of gravity low values very well change in color.
Of course, the accuracy is not high, but we need just to get a general idea of the forces of gravity in the solar system.
Now, "apart" of the planet in the space corresponding to their distance from the sun. To this end, the resulting gradient color need to attach some semblance of the distance scale. Curvature of the orbit, I think, can not be ignored.
But as always cosmic scale, in the truest sense of the words, do not give to see the entire picture. Look, Saturn is about 1430 million kilometers from the Sun, the index corresponding to the color of its orbit is equal to 1738. Ie obtained in one pixel (if you take the scale of one shade of color is one pixel) is about 822, 8 thousand kilometers. A radius of approximately 6371 km of the Earth, ie 12742 kilometers diameter where some 65 times less than one pixel. So how can we respect the proportions.
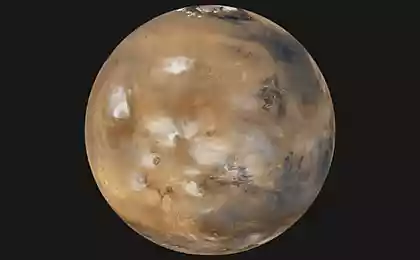
We'll go the other way. © Since we are interested in gravity circumplanetary space, the planet will take individually and paint them and the space around them color corresponding to the gravitational forces of the sun and themselves. For example, take Mercury - the planet's radius of 2, 4 ths. Km. and equate it to a circle with a diameter of 48 pixels, ie, in one pixel will be 100 km. Then Venus and Earth are respectively 121 and 127 pixels. Quite comfortable size.
So, do the image size of 600 by 600 pixels, determine the value of the force of attraction to the Sun in an orbit of Mercury plus / minus 30,000 km (that the planet has turned into the center of the picture) and paint the background gradient shades of color corresponding to these forces.
At the same time, to simplify the task, do not paint over the arcs corresponding to the radius, and the straight vertical lines. (Roughly speaking, our "Sun" will "square" and will always be on the left side.)
To the background color does not show through the image of the planet and the planet zone of attraction, determine the radius of the circle corresponding to the area where the pull of gravity over the planet to the sun and paint it white.
Then put in the center of the image circle, corresponding to the diameter of Mercury on the scale (48 pixels) and fill it with a color corresponding to the gravity of the planet on its surface.
Next, paint the gradient from the planet in accordance with changes of attraction force thereto and constantly compare the color of each point in the layer attraction to Mercury the point with the same coordinates, but a layer of attraction to the sun. When these values are equal, making this pixel black shading and further stop.
So we get some form of visible changes in the force of attraction of the planet and the Sun with a clear boundary between the black.
(I want to do so, but ... did not work, could not do per-pixel comparison of the two layers of the image.) i>
At a distance of 600 pixels equal to 60 thousand. Kilometers (that is, one pixel - 100 km).
The force of attraction to the Sun in an orbit near Mercury and it changes only in a small range, which in this case is indicated by a shade.

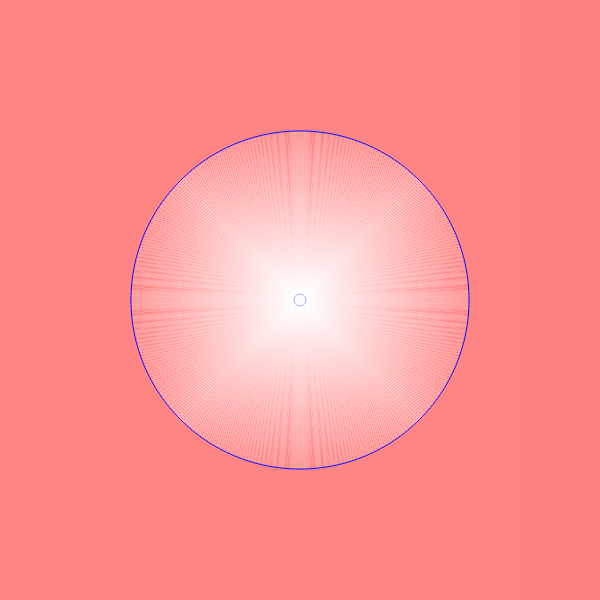
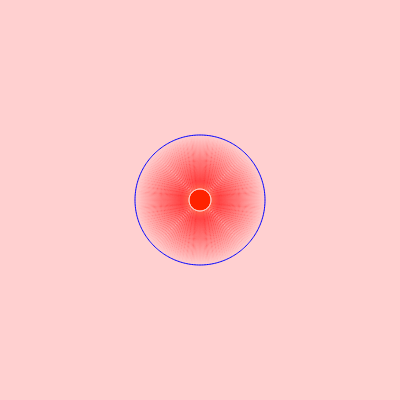
So Mercury and the gravitational force around the world.
Immediately it should be noted that the eight rays is a subtle defects by drawing circles in the Canvas. They have no relation to the subject under discussion and should be easy to overlook.
Dimensions of square 600 by 600 pixels, ie, a space of 60 thousand. kilometers. Radius of 24 pixels Mercury - 2, 4 ths. Km. The radius of the zone of attraction of 23, 7 thousand. Km.
The circle in the center, which is nearly white, is the planet itself and its color corresponds to the weight of our pound test body on the planet's surface - about 373 grams. Thin blue circle shows the boundary between the surface of the planet and the area in which the gravitational force of the planet more than the force of gravity to the sun.
Next, the color gradually changed, becoming more red (ie the weight of the test body is reduced), and finally becomes equal to the color corresponding to the gravity of the Sun at a given location, ie, in the orbit of Mercury. The boundary between the area where the force of gravity to the planet more than the force of gravity to the sun is also marked with a blue circle.
As you can see, there is nothing supernatural.
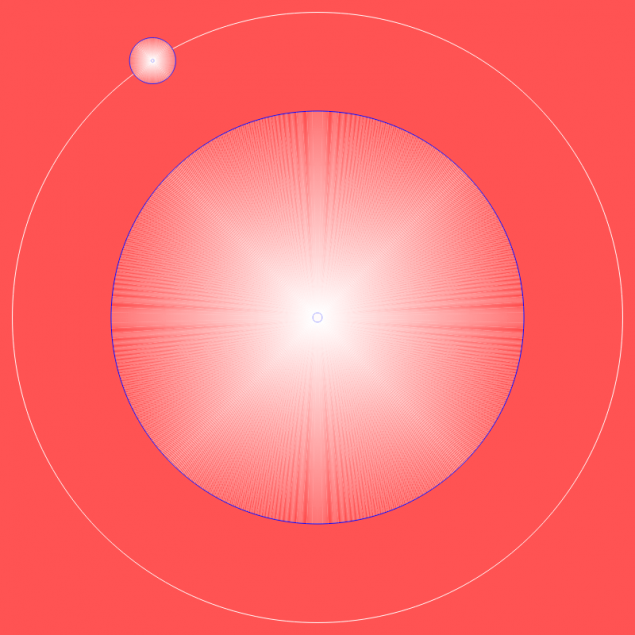
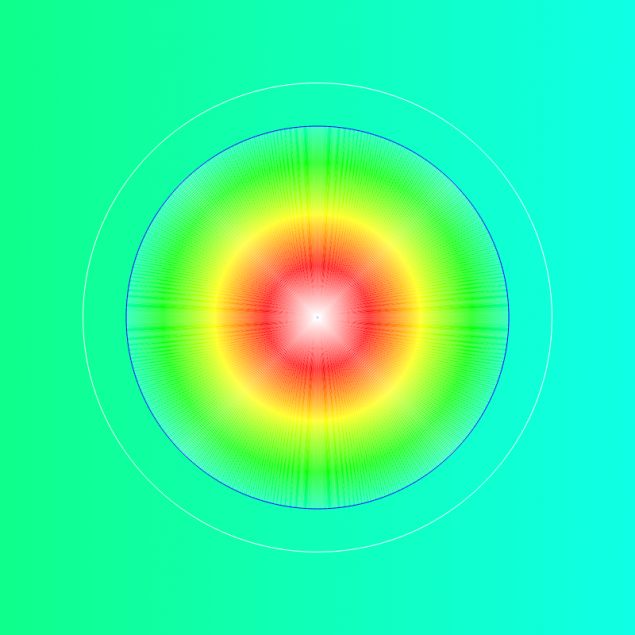
But in the life of a somewhat different picture. For example, in this and all other pictures, the sun is to the left, so actually, the region of attraction of the planet would be somewhat "flattened" stretched left and right. But the image - a circle.
Of course, the best option would be a per-pixel comparison of the domain of attraction of the Sun and the region of attraction of the planet and the selection (display) more of them. But such feats nor I, as the author of this article or JavaScript is not capable of. Working with multidimensional arrays is not a priority for this language, but we can show its work in almost any browser that decided the question of application.
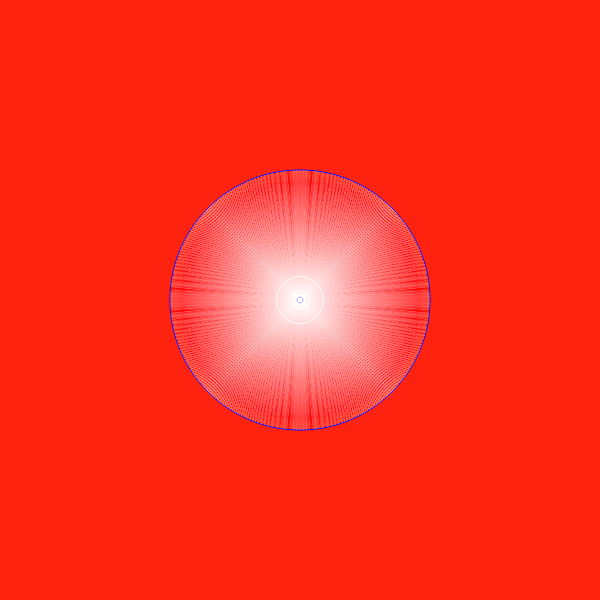
And in the case of Mercury, and all other terrestrial planets, changing the force of attraction to the sun is not so great as to display its available set of shades of color. But when considering the Jupiter and Saturn change the force of attraction to the sun very much.