459
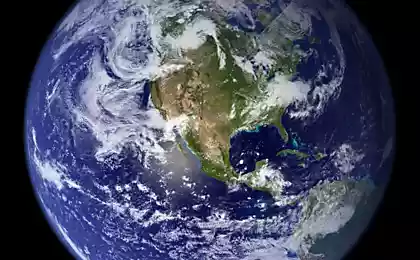
Google Earth has learned to measure the level of carbon dioxide emissions
Google Earth has invented a new interactive map of carbon dioxide emissions. The project was developed together with the American space Agency (NASA) and the U.S. Department of energy, said in a press release NASA.
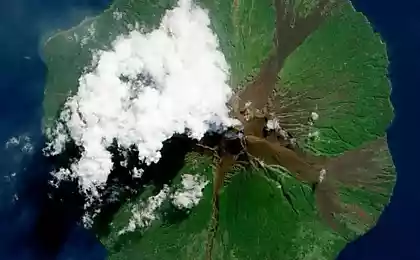
The project was named "Volcano" in the name of the Roman God of fire. On the cards are visible the CO2 emissions from the combustion of 50 different types of fossil fuels. "Volcano" will provide an opportunity to consider how much carbon dioxide is produced by factories, aircraft, ground transportation, housing. The statistics update every hour.

Data "Volcano" gets from several sources. In particular, using information on CO2 emissions provided by the Agency for environmental protection and the US Department of energy and official data on the number of the population. As the developers say the project, so far these have all been in different places, making their analysis impossible.

Until the interactive maps of carbon dioxide emissions have information only about the United States. In the near future, developers are going to add maps of Canada and Mexico.
Source: /users/413