
Microsoft Excel for today is simply indispensable, especially when it comes to handling large amounts of data. However, this program features so much that is not easy to understand what they are really necessary and useful.
And so today
Website will tell you how we can efficiently organize information and break it down.
DataPilot h3> With the help of pivot tables is very convenient sort, calculate the amount and receive the average of the spreadsheet data, with no formula output is not necessary.
< How to apply:
Select Insert & gt; Featured summary tables dialog box, featured pivot tables click on any pivot table layout to see it in the preview mode, and then select the one in which data is displayed fit you properly. Click OK
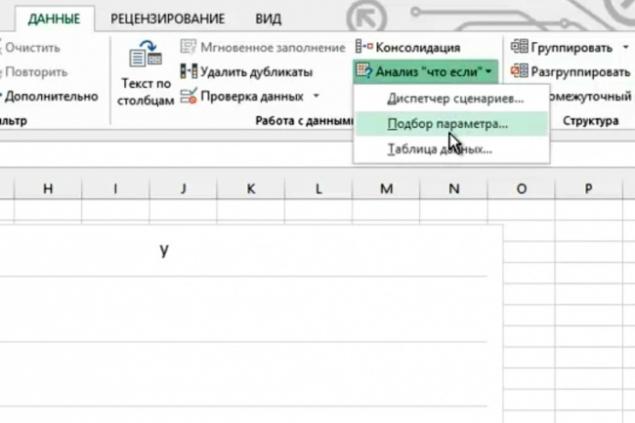
Seek h3> If you know what the result of a formula you need, but can not determine the input values, allowing it to receive, use the selection tool.
< How to apply:
Click Data & gt; Job Data & gt; An analysis of "what-if» & gt; Seek Set in the cell , enter the reference of the cell that contains the formula. In the Value , enter the desired result of the formula. In the Changing the value cell , enter a cell reference, which is corrected by the value, and then click OK
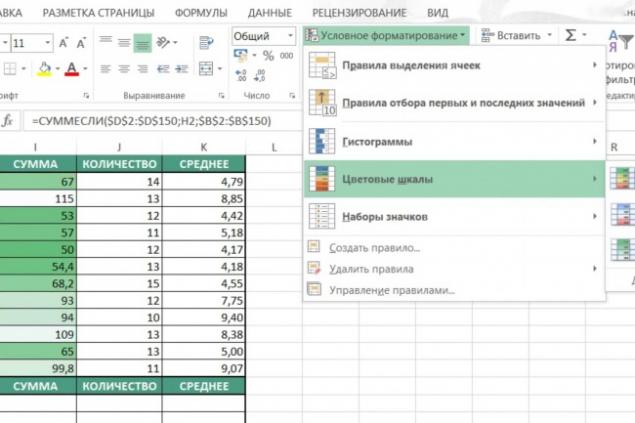
Conditional Formatting h3> Conditional formatting allows you to quickly identify important information on the sheet.
< How to apply:
On the Home in the group Style , click the arrow next to the Conditional Formatting and select the formula that you need.
For example, if you need to select all values less than 100, select Terms of cell delineation & gt; Less , and then dial 100. Before you click OK , you can select the format that will be used for matching values.
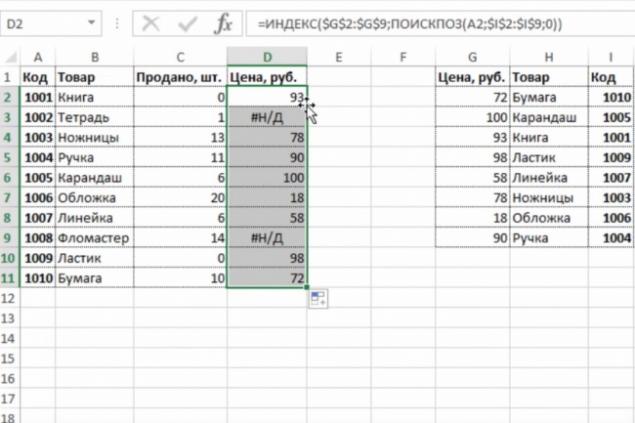
INDEX and MATCH h3> If the CDF helps to find the desired data only in the first column, then, thanks to the functions of the INDEX and MATCH, you can search for information within a table.
< How to apply:
Make sure that the cells form a network with the data which have titles and title strings. Use the MATCH INDEX , and Excel will be able to point to the location where these values intersect. For example: INDEX (array, MATCH (lookup_value, lookup_array, 0), MATCH (lookup_value, lookup_array, 0))
.
The graph "Falls» h3> This is one of the forms of data visualization, which allows you to see which way the figures have changed over a certain period. A very useful thing for those whose work involves finances or statistics.
< How to apply:
The version of Excel 2016 is necessary to select the desired data and select Insert & gt; Waterfall or Figure & gt; Waterfall
Forecast h3> This function allows you to calculate and predict future values based on existing data.
< How to apply:
Select at least two cells that contain the initial values. Click Data & gt; Forecast & gt; forecast Sheet Create a sheet forecast , select the chart or bar graph for a visual representation of the forecast. In the End of the forecast , select the end date, and then click Create
According to the materials: lifehacker.com
Translation and adaptation: Website
via lifehacker.com/seven-useful-microsoft-excel-features-you-may-not-be-us-1753221566?utm_campaign=socialflow_lifehacker_facebook&utm_source=lifehacker_facebook&utm_medium=socialflow